![[Previous]](prev.gif) |
![[Contents]](contents.gif) |
![[Index]](keyword_index.gif) |
![[Next]](next.gif) |
|
|
|
|
 |
This version of this document is no longer maintained. For the latest documentation, see http://www.qnx.com/developers/docs. |
You can select a topic from this diagram:
Use the QNX Memory Analysis perspective to solve memory problems.
In this chapter:
Have you ever had a customer say, "The program was working fine for days, then it just crashed"? If so, chances are good that your program had a memory error -- somewhere.
Debugging memory errors can be frustrating; by the time a problem appears, often by crashing your program, the corruption may already be widespread, making the source of the problem difficult to trace.
The QNX Memory Analysis perspective shows you how your program uses memory and can help ensure that your program won't cause problems. The perspective helps you quickly pinpoint memory errors in your development and testing environments before your customers get your product.
 |
The QNX Memory Analysis perspective may produce incorrect results when more than one IDE is communicating with the same target system. To use this perspective, make sure only one IDE is connected to the target system. |
By design, Neutrino's architecture helps ensure that faults, including memory errors, are confined to the program that caused them. Programs are less likely to cause a cascade of faults because processes are isolated from each other and from the microkernel. Even device drivers behave like regular debuggable processes:
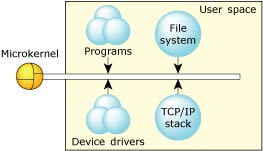
This robust architecture ensures that crashing one program has little or no effect on other programs throughout the system. When a program faults, you can be sure that the error is restricted to that process's operation.
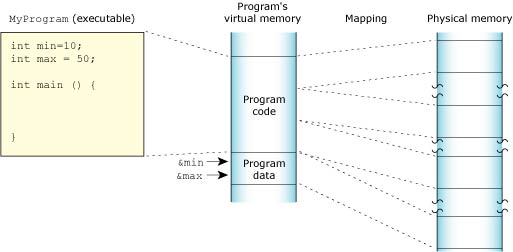
Neutrino's full memory protection means that almost all the memory addresses your program encounters are virtual addresses. The process manager maps your program's virtual memory addresses to the actual physical memory; memory that is contiguous in your program may be transparently split up in your system's physical memory:
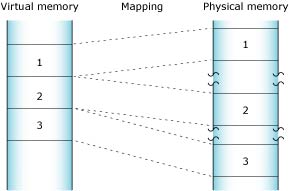
The process manager allocates memory in small pages (typically 4 KB each). To determine the size for your system, use the sysconf(_SC_PAGESIZE) function.
As you'll see when you use the Memory Information view of the QNX System Information perspective, the IDE categorizes your program's virtual address space as follows:
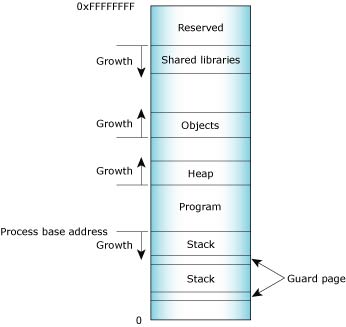
Process memory layout on an x86.
The Memory Information and Malloc Information views of the QNX System Information perspective provide detailed, live views of a process's memory. See the Getting System Information chapter for more information.
Program memory holds the executable contents of your program. The code section contains the read-only execution instructions (i.e. your actual compiled code); the data section contains all the values of the global and static variables used during your program's lifetime:
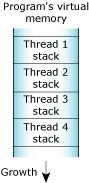
Stack memory holds the local variables and parameters your program's functions use. Each process in Neutrino contains at least the main thread; each of the process's threads has an associated stack. When the program creates a new thread, the program can either allocate the stack and pass it into the thread-creation call, or let the system allocate a default stack size and address:
When your program runs, the process manager reserves the full stack in virtual memory, but not in physical memory. Instead, the process manager requests additional blocks of physical memory only when your program actually needs more stack memory. As one function calls another, the state of the calling function is pushed onto the stack. When the function returns, the local variables and parameters are popped off the stack.
The used portion of the stack holds your thread's state information and takes up physical memory. The unused portion of the stack is initially allocated in virtual address space, but not physical memory:
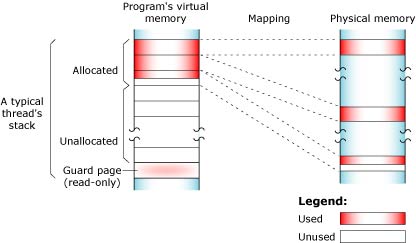
At the end of each virtual stack is a guard page that the microkernel uses to detect stack overflows. If your program writes to an address within the guard page, the microkernel detects the error and sends the process a SIGSEGV signal.
As with other types of memory, the stack memory appears to be contiguous in virtual process memory, but isn't necessarily so in physical memory.
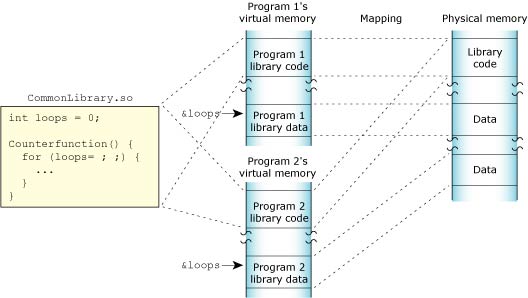
Shared-library memory stores the libraries you require for your process. Like program memory, library memory consists of both code and data sections. In the case of shared libraries, all the processes map to the same physical location for the code section and to unique locations for the data section:
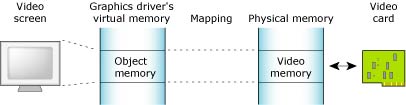
Object memory represents the areas that map into a program's virtual memory space, but this memory may be associated with a physical device. For example, the graphics driver may map the video card's memory to an area of the program's address space:
Heap memory represents the dynamic memory used by programs at runtime. Typically, processes allocate this memory using the malloc(), realloc(), and free() functions. These calls ultimately rely on the mmap() function to reserve memory that the malloc library distributes.
The process manager usually allocates memory in 4 KB blocks, but allocations are typically much smaller. Since it would be wasteful to use 4 KB of physical memory when your program wants only 17 bytes, the malloc library manages the heap. The library dispenses the paged memory in smaller chunks and keeps track of the allocated and unused portions of the page:
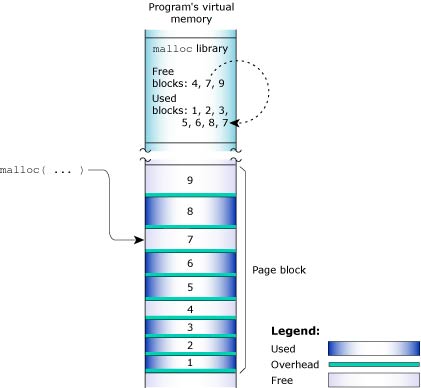
Each allocation uses a small amount of fixed overhead to store internal data structures. Since there's a fixed overhead with respect to block size, the ratio of allocator overhead to data payload is larger for smaller allocation requests.
When your program uses the malloc() function to request a block of memory, the malloc library returns the address of an appropriately sized block. To maintain constant-time allocations, the malloc library may break some memory into fixed blocks. For example, the library may return a 20-byte block to fulfill a request for 17 bytes, a 1088-byte block for a 1088-byte request, and so on.
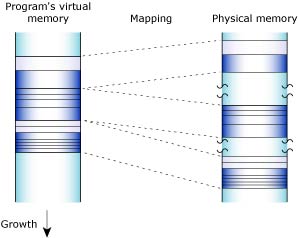
When the malloc library receives an allocation request that it can't meet with its existing heap, the library requests additional physical memory from the process manager. As your program frees memory, the library merges adjacent free blocks to form larger free blocks wherever possible. If an entire memory page becomes free as a result, the library returns that page to the system. The heap thus grows and shrinks in 4 KB increments:
The main system allocator has been instrumented to keep track of statistics associated with allocating and freeing memory. This lets the memory statistics module unintrusively inspect any process's memory usage.
When you launch your program with the Memory Analysis tool, your program uses the debug version of the malloc library (libmalloc_g.so). Besides the normal statistics, this library also tracks the history of every allocation and deallocation, and provides cover functions for the string and memory functions (e.g. strcmp(), memcpy(), memmove()). Each cover function validates the corresponding function's arguments before using them. For example, if you allocate 16 bytes, then forget the terminating NUL character and attempt to copy a 16-byte string into the block using the strcpy() function, the library detects the error.
The debug version of the malloc library uses more memory than the nondebug version. When tracing all calls to malloc() and free(), the library requires additional CPU overhead to process and store the memory-trace events.
|
Be sure to occasionally check the Download Center on our website for updated versions of the debug malloc library. |
The QNX Memory Analysis perspective can help you pinpoint and solve various kinds of problems, including:
Memory leaks can occur if your program allocates memory and then forgets to free it later. Over time, your program consumes more memory than it actually needs.
In its mildest form, a memory leak means that your program uses more memory than it should. QNX Neutrino keeps track of the exact memory your program uses, so once your program terminates, the system recovers all the memory, including the lost memory.
If your program has a severe leak, or leaks slowly but never terminates, it could consume all memory, perhaps even causing certain system services to fail.
The following tabs in the Memory Analysis editor can help you find and fix memory leaks:
For more information about the memory analysis editor, see Viewing memory analysis data (memory analysis editor) later in this chapter. For detailed descriptions about memory errors, see "Interpreting errors during memory analysis".
Memory errors can occur if your program tries to free the same memory twice or uses a stale or invalid pointer. These "silent" errors can cause surprising, random application crashes. The source of the error can be extremely difficult to find, because the incorrect operation could have happened in a different section of code long before an innocent operation triggered a crash. For more information about how to interpret memory errors during memory analysis, see the topic "Interpreting errors during memory analysis" later in this chapter.
In the event of a memory error, the IDE can:
The resulting action that the IDE takes depends on the setting that you chose in the Memory Analysis Tooling part of the launch configuration (see "Analyzing your program," later in this chapter).
The Memory Analysis editor's Errors and Statistics tabs display memory errors and -- if possible -- the exact line of source code that generated each error. The Trace tab lets you find the prior call that accessed the same memory address, even if your program made the call days earlier. For more information about the memory analysis editor, see Viewing memory analysis data (memory analysis editor) later in this chapter. For detailed descriptions about memory errors, see "Interpreting errors during memory analysis".
|
To learn more about the common causes of memory problems, see the topic Heap Analysis: Making Memory Errors a Thing of the Past chapter of the QNX Neutrino Programmer's Guide. |
To extract the most information from your program, you should launch it with the Memory Analysis tool enabled:
This group of configuration options controls the Memory Analysis tool's behavior when memory errors are detected.
When enabled, check the parameters in calls to str*() and mem*() functions for sanity.
When enabled, check the heap's memory chains for consistency before every allocation or deallocation. Note that this checking comes with a performance penalty.
When enabled, check for buffer overruns and underruns. Note that this is possible only for dynamically allocated buffers.
This group of configuration options controls the Memory Analysis tool's memory tracing features.
Controls the Memory Analysis tool's memory snapshot feature.
A list of the libraries that you want to have backtrace information for. For more information, see "Analyzing shared objects," later in this chapter.
These settings let you specify details about how memory debugging will be handled on the target system.
The full path to the device that will receive trace messages. The default is /dev/dbgmem. You can also log traces to a file on the target; for more information, see "Using a file to log the trace," later in this chapter.
The full path to the device that will receive memory events. The default is /dev/dbgmem.
Enable this to use a separate thread for memory tracing operations.
For example, if you attach the Memory Analysis tool to a program that uses fork, it creates a second thread; however, fork only works with single threaded programs. Consequently, the control thread of the Memory Analysis tool must be disabled.
Check this if you'd like to get backtrace information from shared objects that were built with debugging information. For more information, see "Analyzing shared objects," later in this chapter.
Enable this to show messages from the memory-debugging library in the Console view.
This setting lets you choose the type of database used to register the memory traces and events:
A file database that's slower, but uses less memory.
An in-memory database. It's fast, but before grabbing large traces, you should make sure the Java VM has enough memory. You can use the -Xmx option in qde.ini to specify the amount of memory for the Java VM. You must restart the IDE for this option to take effect.
For example, to collect 2 million events and memory traces, you'll need about 2 GB of memory; specify -Xmx2048m. The default size is 512 MB.
|
Don't run more than one Memory Analysis session on a given target at a time, because the results may not be accurate. |
Although the QNX Memory Analysis perspective shows you how your program uses memory, and can quickly direct you to memory errors in your development and testing environments, you need to understand the types of memory errors that you might run into.
During memory analysis, you may encounter the following types of memory errors:
When memory errors occur, the IDE can:
Regardless of which course of action the IDE takes, all of the error and non-error events are available to you in the Trace Event Log.
To include the Trace Event Log in your Task view:
To enable memory analysis:
After you configure the IDE for memory analysis, you can begin to use the results to identify the types of memory errors in your programs, and then trace them back to your code.
To view the memory errors identified by the IDE, and then navigate to those errors:
A dialog with the same name will contain a list of memory errors that the IDE encountered in your program.
The illegal deallocation of memory occurs when a free() operation is performed on a pointer that doesn't point to an appropriate heap memory segment. This type of error can occur when you attempt to do any of the following activities:
The illegal deallocation of memory can generate the following runtime errors:
|
For instructions about enabling error detection in the IDE, see "Enabling error detection for the illegal deallocation of memory". |
In the QNX IDE, the memory analysis feature detects this error (if error detection is enabled), and it traps the illegal deallocation error when any of the following functions are called:
To enable error detection for the illegal deallocation of memory:
In the IDE, you can expect the message for this type of memory error to include the following types of information and detail:
For a list of error messages returned by the Memory Analysis tool, see "Error message summary (memory analysis)".
To help address this memory problem, try the following:
The following code shows an example of the illegal deallocation of memory:
int main(int argc, char ** argv){
  char * str = "";
  if (argc>1) {
     str = malloc(10);
     // ...
  }
  printf("Str: %s\n",str);
  free(str);
  return 0;
}
A NULL pointer dereference is a sub type of an error causing a segmentation fault. It occurs when a program attempts to read or write to memory with a NULL pointer.
Running a program that contains a NULL pointer dereference generates an immediate segmentation fault error.
|
For instructions about enabling error detection in the IDE, see "Enabling error detection for a NULL pointer dereference". |
When the memory analysis feature detects this type of error, it traps these errors for any of the following functions (if error detection is enabled) when they are called within your program:
strcat()
strdup()
strncat()
strcmp()
strncmp()
strcpy()
strncpy()
strlen()
strchr()
strrchr()
index()
rindex()
strpbrk()
strspn() (only the first argument)
strcspn()
strstr()
strtok()
The memory analysis feature doesn't trap errors for the following functions when they are called:
memccpy()
memchrv()
memmove()
memcpy()
memcmp()
memset()
bcopy()
bzero()
memccpy()
memchrv()
memmove()
memcpy()
memcmp()
memset()
bcopy()
bzero()
bcmp()
bcmp()
To enable error detection for the NULL pointer dereference:
In the IDE, you can expect the message for this type of memory error to include the following types of information and detail:
For a list of error messages returned by the Memory Analysis tool, see "Error message summary (memory analysis)".
You can perform an explicit check for NULL for all pointers returned by functions that can return NULL, and when parameters are passed to the function.
The following code shows an example of a NULL pointer dereference:
int main(int argc, char ** argv){
  char buf[255];
  char * ptr = NULL;
  if (argc>1) {
    ptr = argv[1];
  }
  strcpy(str,ptr);
  return 0;
}
A buffer overflow error occurs when a program unintentionally writes to a memory area that's out of bounds of the buffer it intended to write to.
A buffer overflow generates the following runtime errors:
The Memory Analysis tool can detect a limited number of possible buffer overflows with following conditions:
strcat()
strdup()
strncat()
strcmp()
strncmp()
strcpy()
strncpy()
strlen()
strchr()
strrchr()
index()
rindex()
strpbrk()
strspn()
strcspn()
strstr()
strtok()
memccpy()
memchr()
memmove()
memcpy()
memcmp()
memset()
bcopy()
bzero()
bcmp()
To enable error detection for a buffer overflow or underflow:
In the IDE, you can expect the message for this type of memory error to include the following types of information and detail:
For a list of error messages returned by the Memory Analysis tool, see "Error message summary (memory analysis)".
Locate the code where the actual overflow occurred. Ensure that the size of the memory region is always accompanied by the pointer itself, verify all unsafe operations, and that the memory region is large enough to accommodate the data going into that location.
The following code shows an example of a buffer overflow trapped by a library function:
int main(int argc, char ** argv){
  char * ptr = NULL;
  ptr = malloc(12);
  strcpy(ptr,"Hello World!");
  return 0;
}
The following code shows an example of a buffer overflow trapped by a post-heap check in a free() function:
int main(int argc, char ** argv){
  char * ptr = NULL;
  ptr = malloc(12);
  ptr[12]=0;
  free(pre);
  return 0;
}
If you attempt to read or write to memory that was previously freed, the result will be a conflict and the program will generate a memory error. For example, if a program calls the free() function for a particular block and then continues to use that block, it will create a reuse problem when a malloc() call is made.
Using freed memory generates the following runtime errors:
The Memory Analysis tool can detect only a limited number of situations where free memory is read/written with following conditions:
strcat()
strdup()
strncat()
strcmp()
strncmp()
strcpy()
strncpy()
strlen()
strchr()
strrchr()
index()
rindex()
strpbrk()
strspn()
strcspn()
strstr()
strtok()
memccpy()
memchr()
memmove()
memcpy()
memcmp()
memset()
bcopy()
bzero()
bcmp()
malloc()
calloc()
realloc()
free()
To enable error detection when using freed memory:
In the IDE, you can expect the message for this type of memory error to include the following types of information and detail:
For a list of error messages returned by the Memory Analysis tool, see "Error message summary (memory analysis)".
Set the pointer of the freed memory to NULL immediately after the free(), unless it is a local variable that goes out of the scope in the next line of the program.
The following code shows an example using already freed memory:
int main(int argc, char ** argv){
  char * ptr = NULL;
  ptr = malloc(13);
  free(ptr);
  strcpy(ptr,"Hello World!");
  return 0;
}
If you attempt to read or write to memory that was previously freed, the result will be a conflict and the program will generate a memory error because the memory is not initialized.
Using an uninitialized memory read generates a random data read runtime error.
Typically, the IDE does not detect this type of error; however, the Memory Analysis tool does trap the condition of reading uninitialized data from a recently allocated memory region.
For a list of error messages returned by the Memory Analysis tool, see "Error message summary (memory analysis)".
Use the calloc() function, which always initializes data with zeros (0).
The following code shows an example of an uninitialized memory read:
int main(int argc, char ** argv){
  char * ptr = NULL;
  ptr = malloc(13);
  if (argc>1)
     strcpy(ptr,"Hello World!");
  ptr[12]=0;
  printf("%s\n",ptr);
  return 0;
}
Memory leaks can occur if your program allocates memory and then does not free it. For example, a resource leak can occur in a memory region that no longer has references from a process.
Resource leaks generate the following runtime errors:
This error would be trapped during the following circumstances:
In the IDE, you can expect the message for this type of memory error to include the following types of information and detail:
In the IDE, you can expect the message for this type of memory error to include the following types of information and detail:
For a list of error messages returned by the Memory Analysis tool, see "Error message summary (memory analysis)".
To address resource leaks in your program, ensure that memory is deallocated on all paths, including error paths.
The following code shows an example of a memory leak:
int main(int argc, char ** argv){
  char * str = malloc(10);
  if (argc>1) {
     str = malloc(20);
     // ...
  }
  printf("Str: %s\n",str);
  free(str);
  return 0;
}
During memory analysis, the following functions are checked for memory errors:
strcat()
strdup()
strncat()
strcmp()
strncmp()
strcpy()
strncpy()
strlen()
strchr()
strrchr()
index()
rindex()
strpbrk()
strspn()
strcspn()
strstr()
strtok()
memccpy()
memchr()
memmove()
memcpy()
memcmp()
memset()
bcopy()
bzero()
bcmp()
malloc()
calloc()
realloc()
free()
The following table shows a summary of potential error messages you might encounter during memory analysis:
| Message | Caused by | Description |
|---|---|---|
| no errors | ||
| allocator inconsistency - Malloc chain is corrupted, pointers out of order | A buffer overflow occurred in the heap. | The heap memory is corrupted. |
| allocator inconsistency - Malloc chain is corrupted, end before end pointer | A buffer overflow occurred in the heap. | The heap memory is corrupted. |
| pointer does not point to heap area | The illegal deallocation of memory. | You attempted to free non-heap memory. |
| possible overwrite - Malloc block header corrupted | A buffer overflow occurred in the heap. | The heap memory is corrupted. |
| allocator inconsistency - Pointers between this segment and adjoining segments are invalid | A buffer overflow occurred in the heap. | The heap memory is corrupted. |
| data has been written outside allocated memory block | A buffer overflow occurred in the heap. | The program attempted to write data to a region beyond allocated memory. |
| data in free'd memory block has been modified | Attempting to use memory that was previously freed. | The program is attempting to write to a memory region that was previously freed. |
| data area is not in use (can't be freed or realloced) | A buffer overflow occurred in the heap. | The heap memory is corrupted. |
| unable to get additional memory from the system | All memory resources are exhausted. | There are no more memory resources to allocate. |
| pointer points to the heap but not to a user writable area | A buffer overflow occurred in the heap. | The heap memory is corrupted. |
| allocator inconsistency - Malloc segment in free list is in-use | A buffer overflow occurred in the heap. | The heap memory is corrupted. |
| malloc region doesn't have a valid CRC in header | A buffer overflow occurred in the heap. | The heap memory is corrupted. |
| free'd pointer isn't at start of allocated memory block | An illegal deallocation of memory. | An attempt was made to deallocate the pointer that shifted from its original value when it was returned by the allocator. |
The following table shows a summary of Memory Analysis Tool (MAT) graphical user interface options (flags) and their corresponding environment variables:
| Environment variable | Where to find in MAT GUI | What option to set |
|---|---|---|
| MALLOC_TRACEBT=5 | Limit back-trace depth to: 5 | |
| MALLOC_CKALLOC=1 | Enable check on realloc()/free() argument | |
| MALLOC_CKACCESS=1 | Verify the parameters in the string and memory functions | |
| MALLOC_CKCHAIN=1 | Perform a full heap integrity check on every allocation/deallocation | |
| MALLOC_WARN=0 | When an error is detected: report the error and continue | |
| MALLOC_DUMP_ LEAKS=1 | Perform leak check when process exits | |
| MALLOC_TRACEMIN= 20 | Memory Tracing | Minimum allocation to trace: 20 |
| MALLOC_BTDEPTH=10 | Memory Error | Limit back-trace depth to: 10 |
| MALLOC_TRACE= /dev/dbgmem | Memory Tracing | Enable memory allocation/deallocation tracing |
| MALLOC_ERRFILE= /dev/null | N/A | N/A |
| MALLOC_FATAL=0 | When an error is detected: report the error and continue | |
| MALLOC_FILLAREA=1 | Enable bounds checking (where possible) | |
| MALLOC_TRACEMAX= 30 | Memory Tracing | Maximum allocation to trace: 20 |
| MALLOC_CTHREAD=1 | Create control thread | |
| MALLOC_EVENTFILE= /dev/dbgmem | Send events to: | |
| MALLOC_STAT_BINS= 2,4,8,16,32 | N/A | |
| LD_PRELOAD= /tmp/libmalloc_g.so | Target Settings | Malloc library: /tmp/libmalloc_g.so |
You can perform memory analysis on a running program, or you can log the trace to a file on the target system. The advantage of logging the trace is that doing so frees up qconn resources; you run the process and do the analysis later.
|
When analyzing the data from a log file, you can't do any backtracing. |
To log the trace to a file:
A dialog appears:
You can also do this on the command line by setting the appropriate environment variables. For example:
LD_PRELOAD=/tmp/libmalloc_g.so MALLOC_TRACE=/tmp/log.memory
You can perform memory analysis on a running program, if that program was started using the debug malloc library and the proper environment variables. Once the program is running, you can attach the Memory Analysis perspective and gather your data.
For more information, see "Attaching to a running process." in this chapter.
|
If a program uses fork, the control thread of the Memory Analysis tool must be disabled because when you attach the Memory Analysis tool, it creates a second thread; however, fork only works with single threaded programs. To disable the control thread option for memory analysis:
For information about the Create control thread option, see "Analyzing your program" in this chapter. |
LD_PRELOAD=/tmp/libmalloc_g.so MALLOC_CTHREAD=1 ./my_app
As mentioned above, you can analyze memory events and traces for a running process. To do this, you need to create a launch profile, as follows:
After launching, a dialog appears with a list of the running processes on the box. Choose the process you want to attach to; the Session view then lists it. When you select the process in the Session view, the editor displays the information about it.
When you're done, disconnect from the process and let it continue.
In order to analyze shared objects, you must set up the Memory Analysis Tooling tab in your launch configuration:
You can also check the Recurse button to search all subdirectories under a given path.
In the Session View, you can expand your session, expand your process, and then select a shared object to view its memory events and traces in a new tab in the editor.
The QNX Memory Analysis perspective includes the following views:
The Session view lets you manage your memory analysis sessions. You can load these sessions into the Memory Analysis perspective, so you can search for memory management errors in your application.
The view lists all of the memory analysis sessions that you've created in your workspace while running programs with the Memory Analysis tool active. Each session is identified by a name, date stamp, and an icon that indicates its current state.
The icons indicate:
|
If the session is running, you may need to close and reopen the tabs at the top of the editor periodically to refresh the information in the Errors and Statistics panes. |
Right-clicking on a connected session
(![]() )
displays a menu with several options:
)
displays a menu with several options:
Right-clicking on a disconnected session
(![]() )
displays a menu with several options:
)
displays a menu with several options:
Memory analysis sessions must be "connected" before they can be viewed in the Memory Analysis editor. To connect a session:
After a moment, the session is connected
(![]() ).
).
To delete a session:
The IDE deletes the memory analysis session.
To disconnect a session and recover the resources it uses while connected:
After a moment, the session is disconnected
(![]() ).
).
To view information about a session:
The IDE displays a Properties dialog for that memory analysis session:
Occasionally, there may be too much information in a Memory Analysis session, and you might want to filter some of this information to narrow down your search for memory errors, events, and traces.
To filter out Memory Analysis session information:
To rename a memory analysis session:
The IDE displays the Rename Session dialog.
The IDE opens the memory analysis session in the Memory Analysis editor.
You'll use this item after you've logged trace events to a file on the target system and copied the file to your host system. For more information, see "Using a file to log the trace" in the Finding Memory Errors chapter.
When you view a connected memory analysis session, the Memory Analysis perspective opens that session in the main editor area of the IDE:
The top half of the window shows details for the data selected in the bottom half, which is an overview of the entire memory analysis session data set:
The details include a table of information about the allocations. If you select an allocation, a vertical line indicates its position in the Details chart, and the backtrace (if available) is displayed below the table. If you click on a backtrace, the editor displays the associated source code (if available) in another tab.
The icons in the table indicate the type of allocation or deallocation:
The Allocations Overview can be very wide, so it could be broken into pages. You can use the Page field to move from one page to another, and you can specify the number of points to display on each page.
|
If the process does many allocations and deallocations, it could take some time for the traces and events to be registered, indexed, and displayed. |
The tabs at the bottom let you switch between several different data views:
The Memory Analysis perspective updates the details to reflect the data region you've selected.
The Memory Analysis editor has several icons that you can use to control the view:
| Use this icon: | To: |
|---|---|
| Set the Chart and Detail Pane to a horizontal layout, one beside the other | |
| Set the Chart and Detail Pane to a vertical layout, one above the other | |
| Display the Detail Pane if it's currently hidden | |
| Hide the Detail Pane so the Chart pane has more display room | |
| Hide the Chart pane so the Detail Pane has more display room | |
| Toggle the Overview pane on and off |
You can control the Overview pane through its context menu, which is displayed when you right-click on the Overview pane:
This menu includes:
You can control the Detail pane through its context menu:
As described above, the Allocations pane shows you allocation and deallocation events over time. Select a range of events to display a chart and details for those events.
The Errors pane shows any memory errors (in red) or leaks (in blue) detected while collecting statistics. Select a line in the top pane to see a function backtrace in the lower pane.
The allocator keeps counters for allocations of various sizes to help gather statistics about how your application is using memory. Blocks up to each power of two (2, 4, 8, 16, etc. up to 4096) and "large" blocks (anything over 4 KB) are tracked by these counters.
The Bins pane shows the values for these counters over time:
You can disable a counter's display by clicking its circle above the pane's title. Click the circle again to enable that counter's display.
When the Bins pane is displayed, the Chart pane shows allocations and deallocations for each bin at the time selected in the Detail pane. The Detail pane lists memory events for the selected region of the Bins pane.
The Bins pane includes these additional buttons:
Tracing can be slow, and it may also change the timing of the application, because of the logging that's done for each allocation and deallocation. You might want to do a first pass with the bins snapshots enabled to determine the "hot spots or ranges", and on the second pass reduce the tracing to a certain range (minimum, maximum) to filter and reduce the log set.
For efficiency, the QNX allocator preallocates "bands" of memory (small buffers) for satisfying requests for small allocations. This saves you a trip through the kernel's memory manager for small blocks, improving your performance.
The bands handle allocations of up to 16, 24, 32, 48, 64, 80, 96, and 128 bytes in size, and activity in these bands is shown on the Bands pane:
The Usage pane shows your application's overall memory usage over time.
This tab plays back the allocations, synchronized with the bins, bands, or usage, depending on what you last selected. You can use this display to look for memory leaks (e.g. bins where the number of allocations is much greater than the number of deallocations):
The Statistics pane gives you several different statistics views for the Memory Analysis session.
The Allocations pane shows the number of calls to different kinds of allocations, plus a count of each allocation for a given number of bytes:
The Backtraces pane shows you a list of memory event points in your application. Select one to display a function backtrace for that event:
The Outstanding traces pane shows allocations that weren't deallocated when the trace ended. These aren't necessarily errors.
The Errors pane shows you a list of the different types of memory error encountered while running your application.
This tab lets you change the settings for a running process.
For information about the settings, see "Analyzing your program" in the Finding Memory Errors chapter.
The additional icons (from left to right) let you:
|
|
|
|