You can monitor the resource usage for a process through two QNX System Information views that list the file descriptors and other details about the process's active connections.
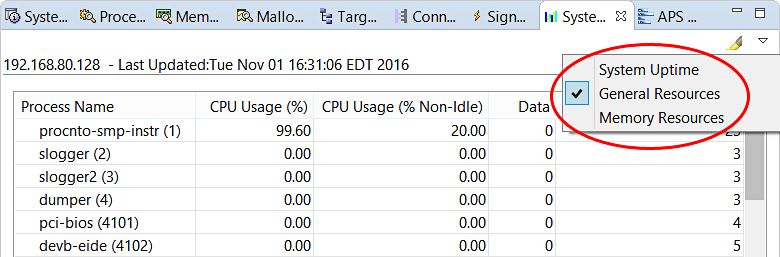
You can examine the File Descriptors column (on the far right) to see if the number is steadily increasing for a particular process. If so, that process is opening file descriptors faster than closing them and might have a design or coding bug. Having too many open file descriptors can notably increase a process's memory footprint or cause it to run out of descriptors and stop working. You can click the column header to sort the process list by this metric, to find which processes are using the most descriptors.
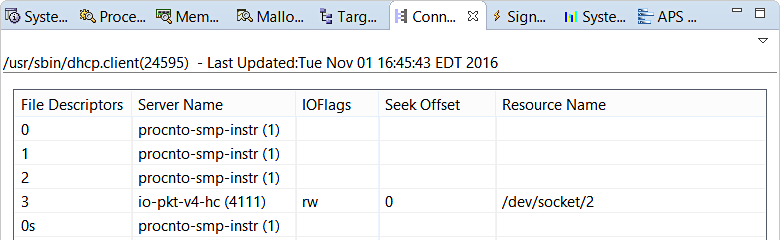
The connections are sorted by the File Descriptors field, in ascending order. For details about the file descriptor numbers (including the s next to some of them) and other fields, see the Connection Information reference. In summary, Server Name specifies the process at the other end of the connection, while Resource Name provides the device path (when applicable). These fields can give you a good idea of which program areas might be leaking descriptors.