Enabling leak detection

To run leak detection on an application and all shared libraries it uses, the application and libraries must be compiled with debug information, and the target should have librcheck.so installed.
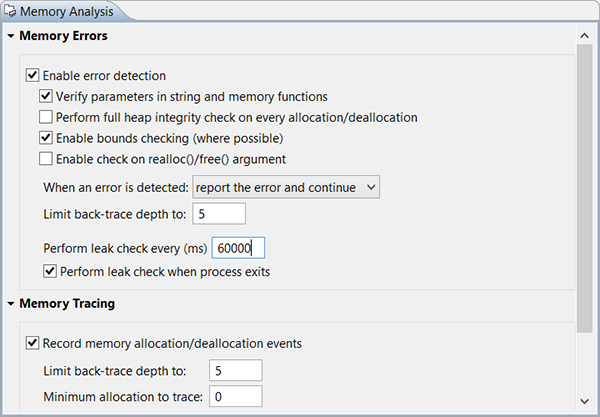
To enable leak detection from the IDE:
  1. Open or create a launch configuration and select the Tools tab.
  2. Click Add/Delete Tool at the bottom.
  3. In the Tools selection dialog, check the Memory Analysis box and click OK.
  4. On the Memory Analysis tab that now appears in the launch configuration, expand Memory Errors.
  5. Enter a nonzero value in the Perform leak check every (ms) field to specify a time interval for leak detection.
    For example, if you want to perform leak detection every minute, enter 60000 (for 60 seconds).
    Memory Analysis Tool - Error Settings
  6. Expand Memory Tracing and ensure Record memory allocation/deallocation events is checked.
    If this memory tracing setting isn't enabled, leaks are detected, but the tool can't do allocation backtracing, which makes them almost impossible to identify.
  7. Check the Perform leak check when process exits box if you want a report of all leaks that remain when your application exits.
    For a reference of all UI fields you can set, see Configuring Memory Analysis sessions.
  8. If you want the IDE to display the QNX Memory Analysis perspective whenever you launch the application, check Switch to this tool's perspective on launch, below the Memory Analysis tab.
  9. Click Run or Debug to launch the application.
As your application runs, the Memory Events and Memory Problems views display the analysis results. For details on using these views, see Interpreting Memory Analysis results.