When you add the Memory Analysis tool to a launch configuration, a new tab appears so you can configure the tool settings:
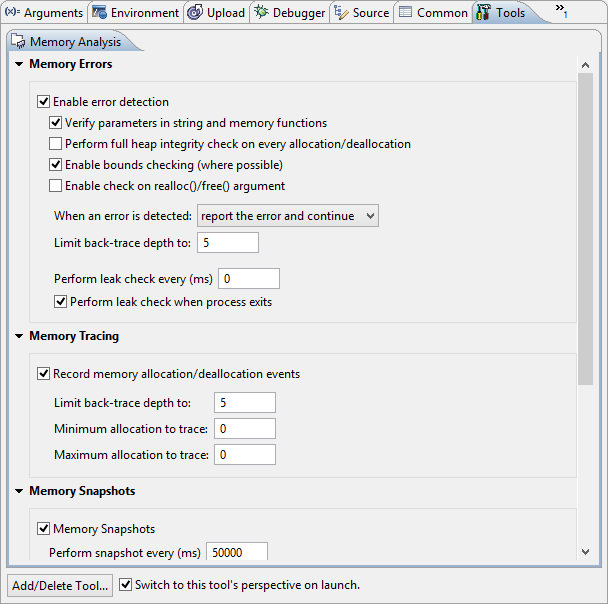
The settings are displayed in four panels (not all are shown in the screenshot above) that you can expand by clicking the
arrows on the left. The panels and their individual fields are:
- Memory Errors
- These configuration options control which memory errors the tool detects, how the tool responds to them, and how it
detects memory leaks.
- Enable error detection
- Check this to detect memory allocation, deallocation, and access errors:
- Verify parameters in string and memory functions — When enabled, check the parameters in calls to str* and mem* functions for sanity.
- Perform full heap integrity check on every allocation/deallocation — When enabled, check the heap's memory chains for consistency before every allocation or deallocation. This type of checking comes with a performance penalty.
- Enable bounds checking (where possible) — When enabled, check for buffer overruns and underruns. This can be done only for dynamically allocated buffers.
- Enable check on realloc()/free() argument — When enabled, check pointer arguments passed to realloc or free. By default, this is enabled.
- When an error is detected
- Take the selected action when a memory error is detected. By default, Memory Analysis reports the error and attempts to continue, but you can also make it launch the debugger or terminate the process.
- Limit trace-back depth to
- Restrict the number of stack frames to record when logging a memory error.
- Perform leak check every (ms)
- Specify how often to check for leaks. This type of checking comes with a performance penalty. Also, the control thread must be enabled for this option to work.
- Perform leak check when process exits
- When checked, print memory leaks when the process exits, before the operating system cleans up the process' resources. For this option to work, the application must exit cleanly, (i.e. using the exit method).
- Memory Tracing
- These options control how the source of a memory problem is traced.
- Enable memory allocation/deallocation tracing
- When checked, trace all memory allocations and deallocations. Tracing is required to provide backtrace of allocation for memory leaks and errors. It can also can be used on its own to inspect allocations.
- Limit back-trace depth to
- Specify the number of stack frames to record when tracing memory events. A higher number significantly increases memory consumption for the application.
- Minimum allocation to trace
- Set the size, in bytes, of the smallest allocation to trace.
- Maximum allocation to trace
- Set the size, in bytes, of the largest allocation to trace. Use 0 for unlimited.
- Memory Snapshots
- These options manage the memory snapshot feature, which records details of heap usage.
- Memory Snapshots
- Enable memory snapshots. Memory snapshots include total memory usage, bins, and bands statistics.
- Perform snapshot every (ms)
- Specify the number of milliseconds between each memory snapshot. Recommended minimum setting is 1000 ms.
- Bins counters
- A comma-separated list of the memory bins you want to trace; for example: 10,100,1000,... Each bin is a container for allocated memory blocks within a certain size range. Unlike a band, a bin is a user-defined value.
- Advanced Settings
- These options specify details about how memory debugging is handled on the target system.
- Runtime library:
- The full path on the target to the memory-debugging library, usually $QNX_TARGET/target_architecture/usr/lib/librcheck.so.
- Use regular file
- Store the data in the file specified in the Target output file or device field. The default is /var/tmp/traces.rmat. If more than one person is using the same target, change the file name to be user-specific or add ${pid} as part of the name; this string will be replaced by the process ID.
- If this option is used, the user process won't be blocked when writing data; however, if the data file exceeds 2G, the remaining log would be lost. For more information, see Performing a postmortem analysis.
- Use streaming device
- Data is collected and streamed directly to the IDE using a "device" created by qconn. The Target output file or device field contains the full path to the device that receives memory events. The default is /dev/rcheck/traces.rmat.
- If this option is used, qconn uses more memory (for a data buffer) and the application will be blocked if it sends data faster than the IDE can read it. But in this case, there is no limit on the size of data that can be transferred.
- Create control thread
- Enable this if you want to control data collection at runtime (such as dumping leaks or snapshots).
- Use dladdr to find dll names
- (Deprecated) Provide backtrace information from shared objects that were built with debugging information.
- This option isn't available for the newer library file, librcheck.so, and it also depends on which library was specified as a Runtime library.
- Show debug output on console
- Enable this to show messages from the memory-debugging library in the Console view.