This view provides backtracing capability for debugging your applications.
When you click an event in the Memory Events view or an error in the Memory Problems view,
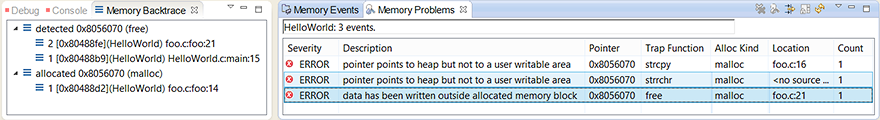
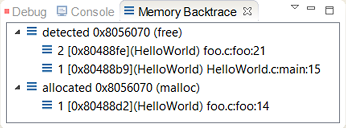
the Memory Backtrace view displays a stack trace showing the calls that led up to the selected event or error:
The Memory Backtrace view lets you trace the stack for the calling thread, a thread within the same process, or
a thread in another process. For memory errors, the stack trace consists of the function address, source file name, and
line of code of each function call in the call sequence. For memory events, the trace consists of these same fields for each
call in the allocation and deallocation chains.
- Backtracing is a best effort, and may at times be inaccurate (e.g., optimized code).
- You can't currently backtrace a thread on a remote node (i.e. over Qnet).
- Backtracing a corrupt stack can cause a fatal SIGSEGV error because libbacktrace doesn't trap it.
- For shared libraries, the IDE can usually find their debug symbols and hence, display their function names and line numbers in the backtrace. For DLLs (and sometimes for shared libraries), to see the backtrace information, you must manually specify the locations of the debug symbols, as explained in "Seeing debug symbols for libraries".