To work with data produced by the Memory Analysis tool, use the QNX Memory
Analysis perspective. You can switch to this perspective by clicking its
icon (![]() )
in the toolbar.
)
in the toolbar.
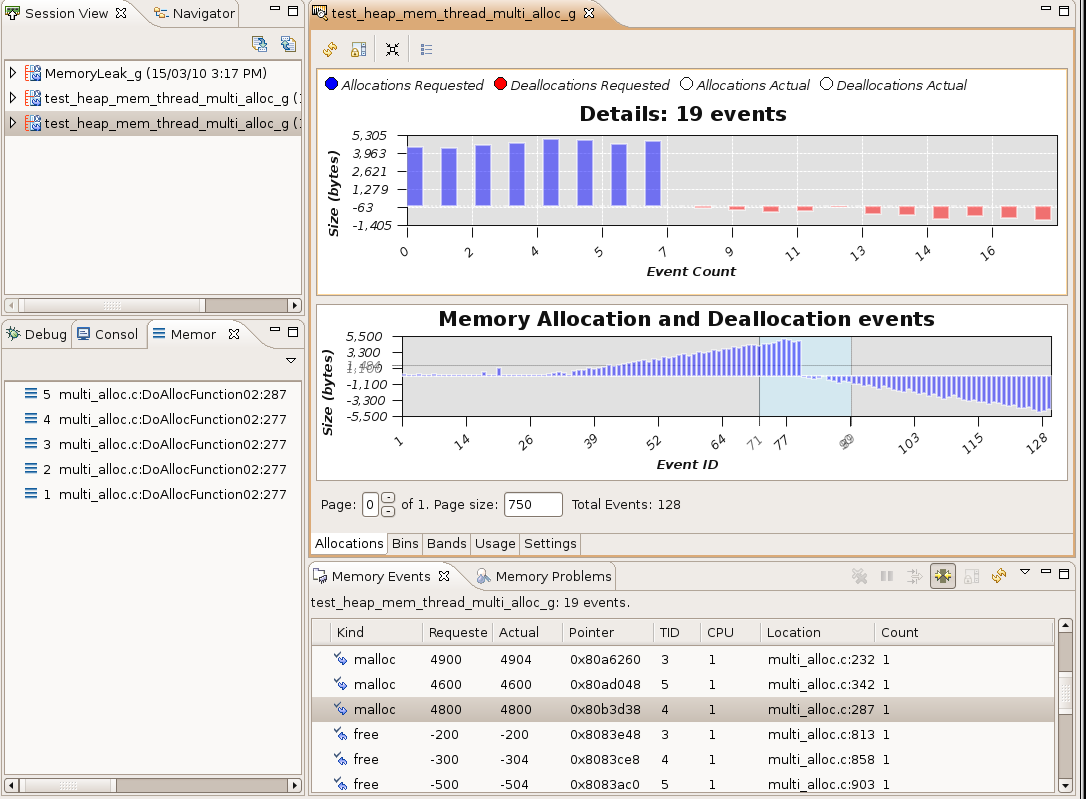
The following views are available in this perspective:
| View | Description |
|---|---|
| Session | Lets you open and close sessions and select data sets to inspect. |
| Memory Problems | Shows a table of problems found in the current session. |
| Memory Events | Shows a table of memory events (allocations and deallocations) found in the current session. |
| Memory Analysis editor | Displays charts for memory events and provide controls for configuring a running session. |
| Debug | Lets you inspect and control running processes. |
| Console | Displays the output from running processes. |
| Memory Backtrace | Lets you inspect backtraces for memory problems and events. |