The following views in the QNX System Information perspective are especially useful for examining the memory of your target system:
- Finding memory errors and leaks
- Virtual address space
Virtual address space
The Memory Information view shows the memory used by the process you select in the Target Navigator view:
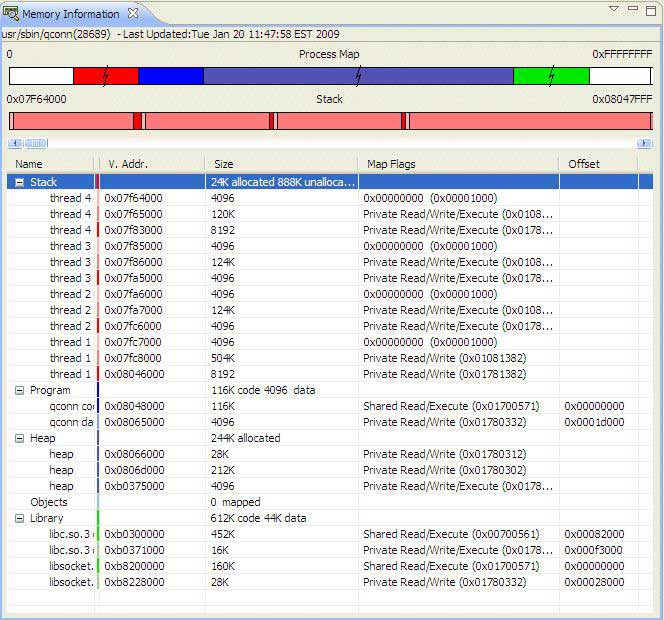
The view shows the following major categories of memory usage:
- Stack (red)
- guard (light)
- unallocated (medium)
- allocated (dark)
- Program (royal blue)
- data (light)
- code (dark)
- Heap (blue violet)
- Objects (powder blue)
- Shared Library (green)
- data (light)
- code (dark)
- Unused (white)
The Process Memory pane shows the overall memory usage. To keep large sections of memory from visually overwhelming smaller sections, the view scales the display semilogarithmically and indicates compressed sections with a split.
Below the Process Memory pane, the Process Memory subpane shows your selected memory category (e.g. Stack, Library) linearly. The subpane colors the memory by subcategory (e.g. a stack's guard page), and shows unused memory.
The Memory Information view's table lists all the memory segments and the associated virtual address, size, permissions, and offset. The major categories list the total sizes for the subcategories (e.g. Library lists the sizes for code/data in the Size column). The Process Memory pane and subpane update their displays as you make selections in the table.
The Memory Information view's table includes the following columns:
- Name
- The name of the category.
- V. Addr.
- The virtual address of the memory.
- Size
- The size of the section of memory. For the major categories, the column lists the totals for the minor categories.
- Map Flags
- The flags and protection bits for the memory block. See the mmap function's flags and prot arguments in the Neutrino Library Reference.
- Offset
- The memory block's offset into shared memory, which is equal to the mmap function's off argument.
- Select the dropdown menu (
 ) in the Memory Information view's title bar and select Categorize.
Stack errors
Stack errors can occur if your program contains functions that are deeply recursive or use a significant amount of local data. Errors of this sort can be difficult to find using conventional testing; although your program seems to work properly during testing, the system could fail in the field, likely when your system is busiest and is needed the most.
The Memory Information view lets you see how much stack memory your program and its threads use. The view can warn you of potential stack errors.
Inefficient heap usage
Your program can experience problems if it uses the heap inefficiently. Memory-allocation operations are expensive, so your program may run slowly if it repeatedly allocates and frees memory, or continuously reallocates memory in small chunks.
The Malloc Information view shows a count of your program's memory allocations; if your program has an unusually high turnover rate, this might mean that the program is allocating and freeing more memory than it should.
You may also find that your program uses a surprising amount of memory, even though you were careful not to allocate more memory than you required. Programs that make many small allocations can incur substantial overhead.
The Malloc Information view lets you see the amount of overhead memory the library uses to manage your program's heap. If the overhead is substantial, you can review the data structures and algorithms used by your program, and then make adjustments so that your program uses its memory resources more efficiently. The Malloc Information view lets you track your program's reduction in overall memory usage.