If you develop a program that dynamically allocates memory, you're also responsible for tracking any memory that you allocate whenever a task is performed, and for releasing that memory when you no longer need it. If you fail to track the memory correctly, you may introduce “memory leaks” or unintentionally write to an area outside of the memory space.
Conventional debugging techniques usually prove to be ineffective for locating the source of corruption or leaks because memory-related errors typically manifest themselves in an unrelated part of the program. Tracking down an error in a multithreaded environment becomes even more complicated because the threads all share the same memory address space.
In this chapter, we'll describe how Neutrino manages the heap and introduce you to some techniques that can help you to diagnose your memory management problems.
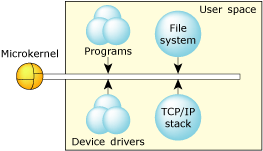
By design, Neutrino's architecture helps ensure that faults, including memory errors, are confined to the program that caused them. Programs are less likely to cause a cascade of faults because processes are isolated from each other and from the microkernel. Even device drivers behave like regular debuggable processes:

The microkernel architecture.
This robust architecture ensures that crashing one program has little or no effect on other programs throughout the system. If a program faults, you can be sure that the error is restricted to that process's operation.
Neutrino's full memory protection means that almost all the memory addresses your program encounters are virtual addresses. The process manager maps your program's virtual memory addresses to the actual physical memory; memory that's contiguous in your program may be transparently split up in your system's physical memory:
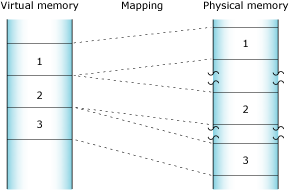
How the process manager allocates memory into pages.
The process manager allocates memory in small pages (typically 4 KB each). To determine the size for your system, use the sysconf() function.
Your program's virtual address space includes the following categories:
In general terms, the memory is laid out as follows:
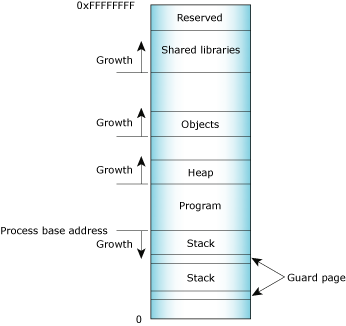
Process memory layout on an x86.
In reality, it's a little more complex. The various types of allocations, stacks, heap, shared objects, etc. have separate places where the memory manager starts looking for free virtual address space. The relative positions of the starting point for the search are as indicated in the diagram. Given those starting points, the memory manager starts looking up (if MAP_BELOW isn't set) or down (if MAP_BELOW is set) in the virtual address space of the process, looking for a free region that's big enough. This tends to make allocations group as the diagram shows, but a shared memory allocation, for example, can be located anywhere in the process address space.
QNX Neutrino 6.5 or later supports address space layout randomization (ASLR), which randomizes the stack start address and code locations in executables and libraries, and heap cookies. With ASLR, the memory manager starts at the appropriate virtual address for the allocation type and searches up or down as appropriate. Once it's found an open spot, it randomly adjusts the address up or down from what it would have used without ASLR.
Use the -mr option for procnto to use ASLR, or -m~r to not use it (the default).
Program memory holds the executable contents of your program. The code section contains the read-only execution instructions (i.e., your actual compiled code); the data section contains all the values of the global and static variables used during your program's lifetime:
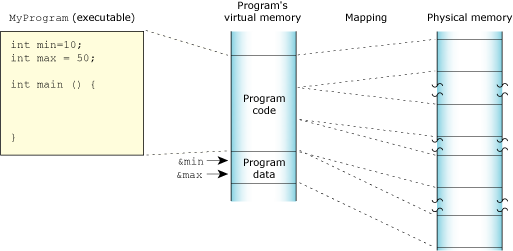
The program memory.
Stack memory holds the local variables and parameters your program's functions use. Each process in Neutrino contains at least the main thread; each of the process's threads has an associated stack. When the program creates a new thread, the program can either allocate the stack and pass it into the thread-creation call, or let the system allocate a default stack size and address.
 |
If you allocate the stack yourself, it's up to you to manage the memory; the rest of this discussion assumes the system allocates the stack. |
If the system allocates the stack, the memory is laid out like this:

The stack memory.
When the process manager creates a thread, it reserves the full stack in virtual memory, but not in physical memory. Instead, the process manager requests additional blocks of physical memory only when your program actually needs more stack memory. As one function calls another, the state of the calling function is pushed onto the stack. When the function returns, the local variables and parameters are popped off the stack.
The used portion of the stack holds your thread's state information and takes up physical memory. The unused portion of the stack is initially allocated in virtual address space, but not physical memory:
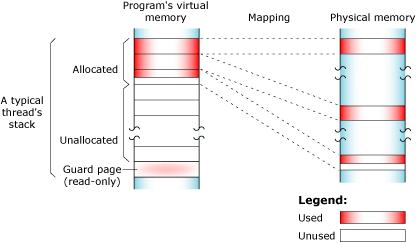
Stack memory: virtual and physical.
At the end of each virtual stack is a guard page that the microkernel uses to detect stack overflows. If your program writes to an address within the guard page, the microkernel detects the error and sends the process a SIGSEGV signal. There's no physical memory associated with the guard page.
As with other types of memory, the stack memory appears to be contiguous in virtual process memory, but isn't necessarily so in physical memory.
Shared-library memory stores the libraries you require for your process. Like program memory, library memory consists of both code and data sections. In the case of shared libraries, all the processes map to the same physical location for the code section and to unique locations for the data section:
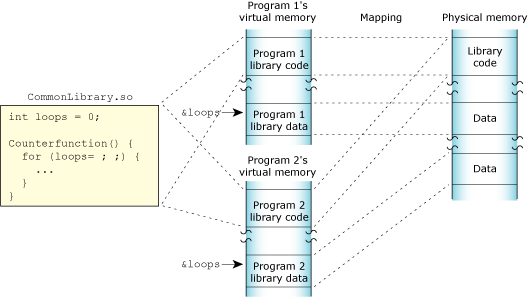
The shared library memory.
Object memory represents the areas that map into a program's virtual memory space, but this memory may be associated with a physical device. For example, the graphics driver may map the video card's memory to an area of the program's address space:

The object memory.
Heap memory represents the dynamic memory used by programs at runtime. Typically, processes allocate this memory using the malloc(), realloc(), and free() functions. These calls ultimately rely on the mmap() function to reserve memory that the library distributes.
The process manager usually allocates memory in 4 KB blocks, but allocations are typically much smaller. Since it would be wasteful to use 4 KB of physical memory when your program wants only 17 bytes, the library manages the heap. The library dispenses the paged memory in smaller chunks and keeps track of the allocated and unused portions of the page:
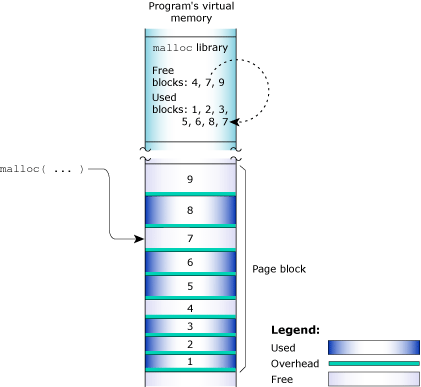
The allocator manages the blocks of memory.
Each allocation uses a small amount of fixed overhead to store internal data structures. Since there's a fixed overhead with respect to block size, the ratio of allocator overhead to data payload is larger for smaller allocation requests.
When your program uses the malloc() function to request a block of memory, the library returns the address of an appropriately sized block. For efficiency, the library includes two allocators:
For example, the library may return a 20-byte block to fulfill a request for 17 bytes, a 1088-byte block for a 1088-byte request, and so on.
When the library receives an allocation request that it can't meet with its existing heap, it requests additional physical memory from the process manager. These allocations are done in chunks called arenas. By default, the arena allocations are performed in 32 KB chunks. The arena size must be a multiple of 4 KB and must currently be less than 256 KB. If your program requests a block that's larger than an arena, the allocator gets a block whose size is a multiple of the arena size from the process manager, gives your program a block of the requested size, and puts any remaining memory on a free list.
When memory is freed, the library merges adjacent free blocks within arenas and may, when appropriate, release an arena back to the OS.

A process's heap memory.
In a program, you dynamically request memory buffers or blocks of a particular size from the runtime environment using malloc(), realloc(), or calloc(), and you release them back to the runtime environment when you no longer need them by using free(). The C++ new and delete operators are built on top of malloc() and free(), so this discussion applies to them as well.
The memory allocator ensures that your requests are satisfied by managing a region of the program's memory area known as the heap. In this heap, the allocator tracks all of the information—such as the size of the original block—about the blocks and heap buffers that it's allocated to your program, in order that it can make the memory available to you during subsequent allocation requests. When a block is released, the allocator places it on a list of available blocks called a free list. It usually keeps the information about a block in the header that precedes the block itself in memory.
The runtime environment grows the size of the heap when it no longer has enough memory available to satisfy allocation requests, and it may return memory from the heap to the OS when the program releases memory.
The basic heap allocation mechanism is broken up into two separate pieces, a chunk-based small block allocator and a list-based large block allocator. By configuring specific parameters, you can select the sizes for the chunks in the small block and also the boundary between the small and large allocators.
Both the small and large block allocators allocate and deallocate memory from the OS in the form of chunks known as arenas by calling mmap() and munmap(). By default, the arena size is 32 KB. It must be a multiple of 4 KB and must currently be less than 256 KB. If your program requests a block that's larger than an arena, the allocator gets a block whose size is a multiple of the arena size from the process manager, gives your program a block of the requested size, and puts any remaining memory on a free list.
You can configure this parameter by doing one of the following:
 |
The MALLOC_* environment variables are checked only at program startup, but changing them is the easiest way to configure the allocator so that these parameters are used for allocations that occur before main(). |
The allocator also attempts to cache recently freed blocks. This cache is shared between the small- and large-block allocators. You can configure the arena cache by setting the following environment variables:
Alternatively, you can call:
mallopt(MALLOC_ARENA_CACHE_MAXSZ, size);
mallopt(MALLOC_ARENA_CACHE_MAXBLK, number);
 |
There's a difference between setting these environment variables and using
the corresponding mallopt() commands:
|
To tell the allocator to never release memory back to the OS, you can set the MALLOC_MEMORY_HOLD environment variable to 1:
export MALLOC_MEMORY_HOLD=1
or call:
mallopt(MALLOC_MEMORY_HOLD, 1);
Once you've used mallopt() to change the values of MALLOC_ARENA_CACHE_MAXSZ and MALLOC_ARENA_CACHE_MAXBLK, you can call mallopt() with a command of MALLOC_ARENA_CACHE_FREE_NOW to immediately adjust the arena cache. The behavior depends on the value argument:
If you don't use the MALLOC_ARENA_CACHE_FREE_NOW command, the changes made to the cache parameters take effect whenever memory is subsequently released to the cache.
You can preallocate and populate the arena cache by setting the MALLOC_MEMORY_PREALLOCATE environment variable to a value that specifies the size of the total arena cache. The cache is populated by multiple arena allocation calls in chunks whose size is specified by the value of MALLOC_ARENA_SIZE.
The preallocation option doesn't alter the MALLOC_ARENA_CACHE_MAXBLK and MALLOC_ARENA_CACHE_MAXSZ options. So if you preallocate 10 MB of memory in cache blocks, and you want to ensure that this memory stays in the application throughout the lifetime of the application, you should also set the values of MALLOC_ARENA_CACHE_MAXBLK and MALLOC_ARENA_CACHE_MAXSZ to something appropriate.
The large block allocator uses a free list to keep track of any available blocks. To minimize fragmentation, the allocator uses a first-fit algorithm to determine which block to use to service a request. If the allocator doesn't have a block that's large enough, it uses mmap() to get memory from the OS in multiples of the arena size, and then carves out the appropriate user pieces from this, putting the remaining memory onto the free list. If all the memory that makes up an arena is eventually freed, the arena is returned to the OS.
The small block allocator manages a pool of memory blocks of different sizes. These blocks are arranged into linked lists called bands; each band contains blocks that are the same size. When your program allocates a small amount of memory, the small block allocator returns a block from the band that best fits your request. Allocations larger than the largest band size are serviced by the large allocator. If there are no more blocks available in the band, the allocator uses mmap() to get an arena from the OS and then divides it into blocks of the required size.
The allocator initially adjusts all band sizes to be multiples of _MALLOC_ALIGN (which is 8). The allocator normalizes the size of each pool so that each band has as many blocks as can be carved from a 4 KB piece of memory, taking into account alignment restrictions and overhead needed by the allocator to manage the blocks. The default band sizes and pool sizes are as follows:
| Band size | Number of blocks |
|---|---|
| _MALLOC_ALIGN × 2 = 16 | 167 |
| _MALLOC_ALIGN × 3 = 24 | 125 |
| _MALLOC_ALIGN × 4 = 32 | 100 |
| _MALLOC_ALIGN × 6 = 48 | 71 |
| _MALLOC_ALIGN × 8 = 64 | 55 |
| _MALLOC_ALIGN × 10 = 80 | 45 |
| _MALLOC_ALIGN × 12 = 96 | 38 |
| _MALLOC_ALIGN × 16 = 128 | 28 |
 |
You might also see references to bins, which are allocation ranges that you want to collect statistics for. For example, you can check how many allocations are done for 40, 80, and 120 byte bins. The default bins are 2, 4, 8, 16, 32, 64, 128, 256, 512, 1024, 2048, 4096, and ULONG_MAX (the last bin catches all allocations larger than 4096 bytes). The bins are completely independent of the bands. |
When used in conjunction with the MALLOC_MEMORY_PREALLOCATE option for the arena cache, the preallocation of blocks in bands is performed by initially populating the arena cache, and then allocating bands from this arena cache.
You can configure the bands by setting the MALLOC_BAND_CONFIG_STR environment variable to a string in this format:
N:s1,n1,p1:s2,n2,p2:s3,n3,p3: ... :sN,nN,pN
where the components are:
The parsing is simple and strict:
If the allocator doesn't like the string, it ignores it completely.
For example, setting MALLOC_BAND_CONFIG_STR to:
8:2,32,60:15,32,60:29,32,60:55,24,60:100,24,60:130,24,60:260,8,60:600,4,60
specifies these bands, with 60 blocks preallocated for each band:
| Band size | Number of blocks |
|---|---|
| 2 | 32 |
| 15 | 32 |
| 29 | 32 |
| 55 | 24 |
| 100 | 24 |
| 130 | 24 |
| 260 | 8 |
| 600 | 4 |
The allocator normalizes this configuration to:
| Band size | Number of blocks |
|---|---|
| 8 | 251 |
| 16 | 167 |
| 32 | 100 |
| 56 | 62 |
| 104 | 35 |
| 136 | 27 |
| 264 | 13 |
| 600 | 5 |
For the above configuration, allocations larger than 600 bytes are serviced by the large block allocator.
Heap corruption occurs when a program damages the allocator's view of the heap. The outcome can be relatively benign and cause a memory leak (where some memory isn't returned to the heap and is inaccessible to the program afterward), or it may be fatal and cause a memory fault, usually within the allocator itself. A memory fault typically occurs within the allocator when it manipulates one or more of its free lists after the heap has been corrupted.
It's especially difficult to identify the source of corruption when the source of the fault is located in another part of the code base. This is likely to happen if the fault occurs when:
When adjacent blocks are used, a program that writes outside of the bounds can corrupt the allocator's information about the block of memory it's using, as well as the allocator's view of the heap. The view may include a block of memory that's before or after the block being used, and it may or may not be allocated. In this case, a fault in the allocator will likely occur during an unrelated attempt to allocate or release memory.
Multithreaded execution may cause a fault to occur in a different thread from the thread that actually corrupted the heap, because threads interleave requests to allocate or release memory.
When the source of corruption is located in another part of the code base, conventional debugging techniques usually prove to be ineffective. Conventional debugging typically applies breakpoints — such as stopping the program from executing — to narrow down the offending section of code. While this may be effective for single-threaded programs, it's often unyielding for multithreaded execution because the fault may occur at an unpredictable time, and the act of debugging the program may influence the appearance of the fault by altering the way that thread execution occurs. Even when the source of the error has been narrowed down, there may be a substantial amount of manipulation performed on the block before it's released, particularly for long-lived heap buffers.
A program that works in a particular memory allocation strategy may abort when the allocation strategy is changed in a minor way. A good example of this is a memory overrun condition (for more information see “Overrun and underrun errors,” below) where the allocator is permitted to return blocks that are larger than requested in order to satisfy allocation requests. Under this circumstance, the program may behave normally in the presence of overrun conditions. But a simple change, such as changing the size of the block requested, may result in the allocation of a block of the exact size requested, resulting in a fatal error for the offending program.
Fatal errors may also occur if the allocator is configured slightly differently, or if the allocator policy is changed in a subsequent release of the runtime library. This makes it all the more important to detect errors early in the life cycle of an application, even if it doesn't exhibit fatal errors in the testing phase.
Some of the most common sources of heap corruption include:
Even the most robust allocator can occasionally fall prey to the above problems. Let's take a look at the last three items in more detail.
Overrun and underrun errors occur when your program writes outside of the bounds of the allocated block. They're one of the most difficult type of heap corruption to track down, and usually the most fatal to program execution.
Overrun errors occur when the program writes past the end of the allocated block. Frequently this causes corruption in an adjacent block in the heap, whether or not it's allocated. When this occurs, the behavior that's observed varies depending on whether that block is allocated or free, and whether it's associated with a part of the program related to the source of the error. When a neighboring block that's allocated becomes corrupted, the corruption is usually apparent when that block is released elsewhere in the program. When an unallocated block becomes corrupted, a fatal error will usually result during a subsequent allocation request. Although this may well be the next allocation request, it actually depends on a complex set of conditions that could result in a fault at a much later point in time, in a completely unrelated section of the program, especially when small blocks of memory are involved.
Underrun errors occur when the program writes before the start of the allocated block. Often they corrupt the header of the block itself, and sometimes, the preceding block in memory. Underrun errors usually result in a fault that occurs when the program attempts to release a corrupted block.
In order to release memory, your program must track the pointer for the allocated block and pass it to the free() function. If the pointer is stale, or if it doesn't point to the exact start of the allocated block, it may result in heap corruption.
A pointer is stale when it refers to a block of memory that's already been released. A duplicate request to free() involves passing free() a stale pointer — there's no way to know whether this pointer refers to unallocated memory, or to memory that's been used to satisfy an allocation request in another part of the program.
Passing a stale pointer to free() may result in a fault in the allocator, or worse, it may release a block that's been used to satisfy another allocation request. If this happens, the code making the allocation request may compete with another section of code that subsequently allocated the same region of heap, resulting in corrupted data for one or both. The most effective way to avoid this error is to NULL out pointers when the block is released, but this is uncommon, and difficult to do when pointers are aliased in any way.
A second common source of errors is to attempt to release an interior pointer (i.e., one that's somewhere inside the allocated block rather than at the beginning). This isn't a legal operation, but it may occur when the pointer has been used in conjunction with pointer arithmetic. The result of providing an interior pointer is highly dependent on the allocator and is largely unpredictable, but it frequently results in a fault in the free() call.
A more rare source of errors is to pass an uninitialized pointer to free(). If the uninitialized pointer is an automatic (stack) variable, it may point to a heap buffer, causing the types of coherency problems described for duplicate free() requests above. If the pointer contains some other non-NULL value, it may cause a fault in the allocator.
If you use uninitialized or stale pointers, you might corrupt the data in a heap buffer that's allocated to another part of the program, or see memory overrun or underrun errors.
The primary goal for detecting heap corruption problems is to correctly identify the source of the error, to avoid getting a fault in the allocator at some later point in time.
A first step to achieving this goal is to create an allocator that's able to determine whether the heap was corrupted on every entry into the allocator, whether it's for an allocation request or for a release request. For example, on a release request, the allocator should be capable of determining whether:
To achieve this goal, we use a replacement library for the allocator that can keep additional block information in the header of every heap buffer. You can use the librcheck.so library while testing the application to help isolate any heap corruption problems.
When this allocator detects a source of heap corruption, it can print an error message indicating:
The library technique can be refined to also detect some of the sources of errors that may still elude detection, such as memory overrun or underrun errors, that occur before the corruption is detected by the allocator. This may be done when the standard libraries are the vehicle for the heap corruption, such as an errant call to memcpy(), for example. In this case, the standard memory manipulation functions and string functions can be replaced with versions that use the information in the librcheck library to determine if their arguments reside in the heap, and whether they would cause the bounds of the heap buffer to be exceeded. Under these conditions, the function can then call the error-reporting functions to provide information about the source of the error.
The librcheck library provides the capabilities described in the above section. It's available when you link your program with the -lrcheck option.
Another way to use the librcheck library is to use the LD_PRELOAD capability to the dynamic loader. The LD_PRELOAD environment variable lets you specify libraries to load prior to any other library in the system. In this case, set the LD_PRELOAD variable as follows:
LD_PRELOAD=librcheck.so
For example:
LD_PRELOAD=librcheck.so ./my_program
By default, the librcheck library provides a minimal level of checking. When an allocation or release request is performed, the library checks only the immediate block under consideration and its neighbors, looking for sources of heap corruption.
Additional checking and more informative error reporting can be done by using additional options provided by the librcheck library. The mallopt() function provides control over the types of checking performed by the library. In addition to reporting the file and line information about the caller when an error is detected, the error-reporting mechanism prints out the file and line information that was associated with the allocation of the offending heap buffer.
To control the use of the librcheck library, you need to include a different header file, <rcheck/malloc.h>. If you want to use any of the additional mallopt() commands that this header file declares, make sure that you link your application with librcheck; the libc version of mallopt() gives an error of EINVAL for these additional commands.
In addition, you may want to add an exit handler that provides a dump of leaked memory, and initialization code that turns on a reasonable level of checking for the debug variant of the program.
The librcheck library keeps additional information in the header of each heap buffer, including header information includes additional storage for keeping doubly-linked lists of all allocated blocks, file, line, and other debug information, flags, and a CRC of the header. The allocation policies and configuration are identical to the normal memory allocation routines except for the additional internal overhead imposed by the librcheck library. This allows the librcheck library to perform checks without altering the size of blocks requested by the program. Such manipulation could result in an alteration of the behavior of the program with respect to the allocator, yielding different results when linked against the librcheck library.
All allocated blocks are integrated into a number of allocation chains associated with allocated regions of memory kept by the allocator in arenas or blocks. The librcheck library has intimate knowledge about the internal structures of the allocator, allowing it to use short cuts to find the correct heap buffer associated with any pointer, resorting to a lookup on the appropriate allocation chain only when necessary. This minimizes the performance penalty associated with validating pointers, but it's still significant.
The time and space overheads imposed by the librcheck library are too great to make it suitable for use as a production library, but are manageable enough to allow them to be used during the test phase of development and during program maintenance.
The librcheck library provides a minimal level of checking by default. This includes a check of the integrity of the allocation chain at the point of the local heap buffer on every allocation request. In addition, the flags and CRC of the header are checked for integrity. When the library can locate the neighboring heap buffers, it also checks their integrity. There are also checks specific to each type of allocation request that are done. Call-specific checks are described according to the type of call below.
You can enable additional checks by using the mallopt() call. For more information on the types of checking, and the sources of heap corruption that can be detected, see “Controlling the level of checking,” below.
When a heap buffer is allocated using any of the heap-allocation routines, the heap buffer is added to the allocation chain for the arena or block within the heap that the heap buffer was allocated from. At this time, any problems detected in the allocation chain for the arena or block are reported. After successfully inserting the allocated buffer in the allocation chain, the previous and next buffers in the chain are also checked for consistency.
When an attempt is made to resize a buffer through a call to the realloc() function, the pointer is checked for validity if it's a non-NULL value. If it's valid, the header of the heap buffer is checked for consistency. If the buffer is large enough to satisfy the request, the buffer header is modified, and the call returns. If a new buffer is required to satisfy the request, memory allocation is performed to obtain a new buffer large enough to satisfy the request with the same consistency checks being applied as in the case of memory allocation described above. The original buffer is then released.
If fill-area boundary checking is enabled (described in the “Controlling the level of checking” section), the guard code checks are also performed on the allocated buffer before it's actually resized. If a new buffer is used, the guard code checks are done just before releasing the old buffer.
This includes, but isn't limited to, checking to ensure that the pointer provided to a free() request is correct and points to an allocated heap buffer. Guard code checks may also be performed on release operations to allow fill-area boundary checking.
You can use environment variables or the mallopt() function to enable extra checks within the librcheck library. If you decide to use mallopt(), you have to modify your application to enable the additional checks. Using environment variables lets you specify options that go into effect from the time the program runs. If your program does a lot of allocations before main(), setting options using mallopt() may be too late. In such cases, it's better to use environment variables.
The prototype of mallopt() is:
int mallopt ( int cmd,
              int value );
The arguments are:
We look at some of the other commands later in this chapter.
For information about all the commands, see the entry for mallopt() in the Neutrino Library Reference. Let's look at the commands that control the additional checks:
Environment variable: MALLOC_CKACCESS
This helps to detect buffer overruns and underruns that are a result of memory or string operations. When on, each pointer operand to a memory or string operation is checked to see if it's a heap buffer. If it is, the size of the heap buffer is checked, and the information is used to ensure that no assignments are made beyond the bounds of the heap buffer. If an attempt is made that would assign past the buffer boundary, a diagnostic warning message is printed.
Here's how you can use this option to find an overrun error:
...
char *p;
int opt;
opt = 1;
mallopt(MALLOC_CKACCESS, opt);
p = malloc(strlen("hello"));
strcpy(p, "hello, there!");  /* a warning is generated
                                          here */
...
The following illustrates how access checking can trap a reference through a stale pointer:
...

char *p;
int opt;
opt = 1;
mallopt(MALLOC_CKACCESS, opt);
p = malloc(30);
free(p);
strcpy(p, "hello, there!");
Environment variable: MALLOC_CKBOUNDS
It does this by applying a guard code check when the buffer is released or when it's resized. The guard code check works by filling any excess space available at the end of the heap buffer with a pattern of bytes. When the buffer is released or resized, the trailing portion is checked to see if the pattern is still present. If not, a diagnostic warning message is printed.
The effect of turning on fill-area boundary checking is a little different than enabling other checks: the checking is performed only on memory buffers allocated after the check was enabled, and not on memory buffers allocated earlier.
Here's how you can catch an overrun with the fill-area boundary checking option:
...
...
int *foo, *p, i, opt;
opt = 1;
mallopt(MALLOC_CKBOUNDS, opt);
foo = (int *)malloc(10*4);
for (p = foo, i = 12; i > 0; p++, i--)
    *p = 89;
free(foo);  /* a warning is generated here */
Environment variable: MALLOC_CKCHAIN
This kind of corruption can occur under a number of circumstances, particularly when they're related to direct pointer assignments. In this case, the fault may occur before a check such as fill-area boundary checking can be applied. There are also circumstances in which both fill-area boundary checking and the normal attempts to check the headers of neighboring buffer fail to detect the source of the problem. This may happen if the buffer that's overrun is the first or last buffer associated with a block or arena. It may also happen when the allocator chooses to satisfy some requests, particularly those for large buffers, with a buffer that exactly fits the program's requested size.
Full-chain checking traverses the entire set of allocation chains for all arenas and blocks in the heap every time a memory operation (including allocation requests) is performed. This lets the developer narrow down the search for a source of corruption to the nearest memory operation.
You can force a full allocation chain check at certain points while your program is executing, without turning on chain checking. Specify the following option for cmd:
Typically, when the library detects an error, it displays a diagnostic message, and the program continues executing. In cases where the allocation chains or another crucial part of the allocator's view is hopelessly corrupted, an error message is printed and the program is aborted (via abort()).
You can override this default behavior by using the librcheck version of mallopt() to specify what to do when a warning or a fatal condition is detected:
Environment variable: MALLOC_ACTION, which sets the handling for fatal errors and warnings to the same value.
| Symbolic name | Value | Action |
|---|---|---|
| M_HANDLE_IGNORE | 0 | Ignore the error and continue |
| M_HANDLE_ABORT | 1 | Terminate execution with a call to abort() |
| M_HANDLE_EXIT | 2 | Exit immediately |
| M_HANDLE_CORE | 3 | Cause the program to dump a core file |
| M_HANDLE_STOP | 4 | Send a stop signal (SIGSTOP) to the current thread. This lets you attach to this process using a debugger. The program is stopped inside the error-handler function, and a backtrace from there should show you the exact location of the error. |
If you use the environment variable, you must set it to one of the numeric values, not the corresponding M_HANDLE_* symbolic name.
If you call mallopt(), you can OR any of these handlers with M_HANDLE_DUMP, to cause a complete dump of the heap before the handler takes action.
Here's how you can cause a memory overrun error to abort your program:
...
int *foo, *p, i;
int opt;

opt = 1;
mallopt(MALLOC_CKBOUNDS,  opt);
foo = (int *)malloc(10*4);
for (p = foo, i = 12; i > 0; p++, i--)
    *p = 89;

opt = M_HANDLE_ABORT;
mallopt(MALLOC_WARN, opt);
free(foo); /* a fatal error is generated here */
 |
These environment variables were added in QNX Momentics 6.3.0 SP2. |
There are times when it may be desirable to obtain information about a particular heap buffer or print a diagnostic or warning message related to that heap buffer. This is particularly true when the program has its own routines providing memory manipulation and you wish to provide bounds checking. This can also be useful for adding additional bounds checking to a program to isolate a problem such as a buffer overrun or underrun that isn't associated with a call to a memory or string function.
In the latter case, rather than keeping a pointer and performing direct manipulations on the pointer, you can define a pointer type that contains all relevant information about the pointer, including the current value, the base pointer, and the extent of the buffer. You could then control access to the pointer through macros or access functions. The access functions can perform the necessary bounds checks and print a warning message in response to attempts to exceed the bounds.
The ability of the librcheck library to keep full allocation chains of all the heap memory allocated by the program — as opposed to just accounting for some heap buffers — allows heap memory leaks to be detected by the library in response to requests by the program. Leaks can be detected in the program by performing tracing on the entire heap. This is described in the sections that follow.
Tracing is an operation that attempts to determine whether a heap object is reachable by the program. In order to be reachable, a heap buffer must be available either directly or indirectly from a pointer in a global variable or on the stack of one of the threads. If this isn't the case, then the heap buffer is no longer visible to the program and can't be accessed without constructing a pointer that refers to the heap buffer — presumably by obtaining it from a persistent store such as a file or a shared memory object.
The set of global variables and stack for all threads is called the root set. Because the root set must be stable for tracing to yield valid results, tracing requires that all threads other than the one performing the trace be suspended while the trace is performed.
Tracing operates by constructing a reachability graph of the entire heap. It begins with a root set scan that determines the root set comprising the initial state of the reachability graph. The roots that can be found by tracing are:
Once the root set scan is complete, tracing initiates a mark operation for each element of the root set. The mark operation looks at a node of the reachability graph, scanning the memory space represented by the node, looking for pointers into the heap. Since the program may not actually have a pointer directly to the start of the buffer — but to some interior location — and it isn't possible to know which part of the root set or a heap object actually contains a pointer, tracing uses specialized techniques for coping with ambiguous roots. The approach taken is described as a conservative pointer estimation since it assumes that any word-sized object on a word-aligned memory cell that could point to a heap buffer or the interior of that heap buffer actually points to the heap buffer itself.
Using conservative pointer estimation for dealing with ambiguous roots, the mark operation finds all children of a node of the reachability graph. For each child in the heap that's found, it checks to see whether the heap buffer has been marked as referenced. If the buffer has been marked, the operation moves on to the next child. Otherwise, the trace marks the buffer, and then recursively initiates a mark operation on that heap buffer.
The tracing operation is complete when the reachability graph has been fully traversed. At this time every heap buffer that's reachable will have been marked, as could some buffers that aren't actually reachable, due to the conservative pointer estimation. Any heap buffer that hasn't been marked is definitely unreachable, constituting a memory leak. At the end of the tracing operation, all unmarked nodes can be reported as leaks.
A program can cause a trace to be performed and memory leaks to be reported by calling the librcheck version of mallopt() with a command of MALLOC_DUMP_LEAKS:
mallopt( MALLOC_DUMP_LEAKS, 1);
The second argument is ignored.
The dump of unreferenced buffers prints out one line of information for each unreferenced buffer. The information provided for a buffer includes:
File and line information is available if the call to allocate the buffer was made using one of the library's debug interfaces. Otherwise, the return address of the call is reported in place of the line number. In some circumstances, no return address information is available. This usually indicates that the call was made from a function with no frame information, such as the system libraries. In such cases, the entry can usually be ignored and probably isn't a leak.
From the way tracing is performed, we can see that some leaks may escape detection and may not be reported in the output. This happens if the root set or a reachable buffer in the heap has something that looks like a pointer to the buffer.
Likewise, you should check each reported leak against the suspected code identified by the line or call return address information. If the code in question keeps interior pointers — pointers to a location inside the buffer, rather than the start of the buffer — the trace operation will likely fail to find a reference to the buffer. In this case, the buffer may well not be a leak. In other cases, there is almost certainly a memory leak.
There are some additional techniques that you can use in C++ programs.
The <rcheck/malloc.h> header file defines a CheckedPtr template that you can use in place of a raw pointer in C++ programs. In order to use this template, you must link your program with librcheck.
This template acts as a smart pointer; its initializers obtain complete information about the heap buffer on an assignment operation and initialize the current pointer position. Any attempt to dereference the pointer causes bounds checking to be performed and prints a diagnostic error in response an attempt to dereference a value beyond the bounds of the buffer.
You can modify this template to suit the needs of the program. The bounds checking performed by the checked pointer is restricted to checking the actual bounds of the heap buffer, rather than the program requested size.
For C programs it's possible to compile individual modules that obey certain rules with the C++ compiler to get the behavior of the CheckedPtr template. C modules obeying these rules are written to a dialect of ANSI C referred to as Clean C.
The Clean C dialect is the subset of ANSI C that's compatible with the C++ language. Writing Clean C requires imposing coding conventions to the C code that restrict use to features that are acceptable to a C++ compiler. This section provides a summary of some of the more pertinent points to be considered. It is a mostly complete but by no means exhaustive list of the rules that must be applied.
To use the C++ checked pointers, the module including all header files it includes must be compatible with the Clean C subset. All the system header files for Neutrino satisfy this requirement.
The most obvious aspect to Clean C is that it must be strict ANSI C with respect to function prototypes and declarations. The use of K&R prototypes or definitions isn't allowed in Clean C. Similarly, you can't use default types for variable and function declarations.
Another important consideration for declarations is that you must provide forward declarations when referencing an incomplete structure or union. This frequently occurs for linked data structures such as trees or lists. In this case, the forward declaration must occur before any declaration of a pointer to the object in the same or another structure or union. For example, you could declare a list node as follows:
struct ListNode;
struct ListNode {
   struct ListNode *next;
   void *data;
};
Operations on void pointers are more restrictive in C++. In particular, implicit coercions from void pointers to other types aren't allowed, including both integer types and other pointer types. You must explicitly cast void pointers to other types.
The use of const should be consistent with C++ usage. In particular, pointers that are declared as const must always be used in a compatible fashion. You can't pass const pointers as non-const arguments to functions unless you typecast the const away.
Here's how you could use checked pointers in the overrun example given earlier to determine the exact source of the error:
typedef CheckedPtr<int> intp_t;
...
intp_t foo, p;
int i;
int opt;
opt = 1;
mallopt(MALLOC_CKBOUNDS, opt);
foo = (int *)malloc(10*4);
opt = M_HANDLE_ABORT;
mallopt(MALLOC_WARN, opt);
for (p = foo, i = 12; i > 0; p++, i--)
    *p = 89; /* a fatal error is generated here */
opt = M_HANDLE_IGNORE;
mallopt(MALLOC_WARN, opt);
free(foo);
Because you're using the CheckedPtr template, you must link this program with librcheck.