A memory leak is a portion of heap memory that was allocated but not freed, and the reference to that area of memory can't be used by the application any longer. Typically, the elimination of a memory leak is critical for applications that run continuously because even a single byte leak can crash a mission critical application that runs over time.
Memory leaks can occur if your program allocates memory and then forgets to free it later. Over time, your program consumes more memory than it actually needs.
In its mildest form, a memory leak means that your program uses more memory than it should. QNX Neutrino keeps track of the exact memory your program uses, so once your program terminates, the system recovers all the memory, including the lost memory.
If your program has a severe leak, or leaks slowly but never terminates, it could consume all memory, perhaps even causing certain system services to fail.
There are two types of memory leaks: apparent and subtle. An apparent memory leak is a chunk of heap memory that's never referred from active memory, a subtle leak is memory that is still referred to but shouldn't be, i.e. a hash or dynamic array holds the references.
The Memory Analysis tool can help you to detect both of these types of leaks.
Memory Analysis tooling consists of IDE Visualization tools and a runtime library called librcheck.so. The library overrides the allocator and implements an algorithm that's able to detect memory leaks in the runtime. You don't need to re-compile your program to enable error detection; the library can be pre-loaded at runtime if you're running your program with Memory Analysis enabled.
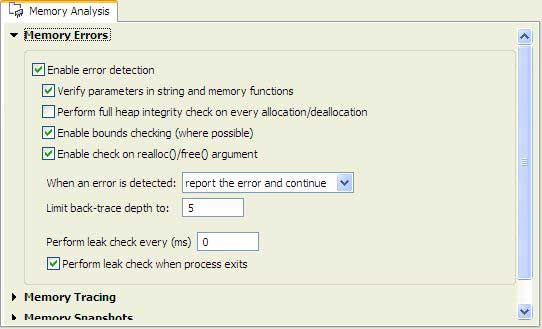
- See the “Perform leak check when process exits” option in the topic Enabling leak detection
- See “Perform leak check every (ms)”in the topic Enabling leak detection
- See “Get Leaks button” in the topic Enabling leak detection
- See “Dumping leaks using an API” in the topic The Memory Analysis tooling API
To enable leak detection from the IDE:
- From an existing launch configuration, select the Tools tab.
- Select Add/Delete Tool.
- Select Memory Analysis and click OK.
The easiest way to detect leaks is to specify a time interval for leak detection. For example, if you want to enable leak detection every minute, enter 60000 (for 60 seconds) in the Perform leak check every (ms) field.
- Select the Switch to this tool's perspective on launch' option.
- After enabling Memory Analysis in a launch configuration, run that configuration.
There are a few other ways to enable memory analysis, including attaching to a running application or postmortem analysis. For more information about these and other launch options, see Launching your program with Memory Analysis.
The following tools in the Memory Analysis perspective can help you find and fix memory leaks:
Memory Problems view — shows you all found “apparent” memory leaks (unreachable blocks).

- Memory Traces view — shows you all of the instances where your program allocates, reallocates, and frees memory. The view lets you hide allocations that have a matching deallocation; the remaining allocations are either still in use or forgotten. See topic Inspecting outstanding allocations for details.
For detail information about enabling memory leaks detection and understanding the findings, see the information in the sections below.