To launch your program with memory analysis from IDE:
- Create a Run or Debug type of QNX Application launch configuration as you normally would, but don't click Run or Debug.
- In the Create, manage, and run configurations dialog, click the Tools tab.
- Click Add/Delete Tool.
In the Tools Selection dialog, check Memory Analysis.
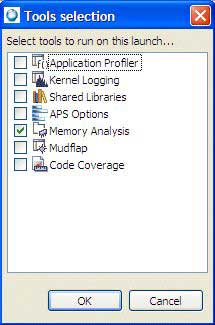
- Click OK.
Click the Memory Analysis tab.

- To configure the Memory Analysis settings for your program, expand the groups to view the appropriate set of options:
-
Memory Errors
This group of configuration options controls the Memory Analysis tool's behavior when memory errors are detected.
- Enable error detection
- Check this to detect memory allocation, deallocation, and access errors:
-
Verify parameters in string and memory functions
When enabled, check the parameters in calls to str*() and mem*() functions for sanity.
-
Perform full heap integrity check on every allocation/deallocation
When enabled, check the heap's memory chains for consistency before every allocation or deallocation. Note that this type of checking comes with a performance penalty.
-
Enable bounds checking (where possible)
When enabled, check for buffer overruns and underruns. Note that this is possible only for dynamically allocated buffers.
-
Verify parameters in string and memory functions
- When an error is detected
- Memory Analysis takes the selected action when a memory error is detected. By default, it reports the error and attempts to continue, but you can also choose to launch the debugger or terminate the process.
- Limit trace-back depth to
- Specify the number of stack frames to record when logging a memory error.
- Perform leak check every (ms)
- Specify how often you want to check for leaks. Note that this type of checking comes with a performance penalty. The control thread must be enabled for this option to work.
- Perform leak check when process exits
- When checked, prints memory leaks when the process exits, before the operating system cleans up the process's resources. For this option to work, the application must exist cleanly, i.e. using the exit method.
-
Memory Tracing
This group of configuration options controls the Memory Analysis tool's memory tracing features.
- Enable memory allocation/deallocation tracing
- When checked, trace all memory allocations and deallocations. Tracing is required to provide backtrace of allocation for memory leaks and errors. It can also can be used on its own to inspect allocations.
- Limit back-trace depth to
- Specify the number of stack frames to record when tracing memory events. A higher number significantly increases memory consumption for the application.
- Minimum allocation to trace
- The size, in bytes, of the smallest allocation to trace.
- Maximum allocation to trace
- The size, in bytes, of the largest allocation to trace. Use 0 for unlimited.
- Perform tracing every (ms)
- (Deprecated) How often to collect information about your program's allocation and deallocation activity. When setting this, consider how often your program allocates and deallocates memory, and for how long you plan to run the program. Note: This option is not supported by the latest library. Now, you can only turn tracing on or off.
-
Memory Snapshots
Controls the Memory Analysis tool's memory snapshot feature.
- Memory Snapshots
- Enable memory snapshots. Memory snapshots include total memory usage, bins and bands statistics.
- Perform snapshot every (ms)
- Specify the number of milliseconds between each memory snapshot. Recommended minim settings is 1000 ms (= 1 sec)
- Bins counters (comma separated) ex: 10,100,1000,...
- A comma-separated list of the memory bins you want to trace. A bin is a container for memory blocks of the same size (within a bin range). In comparison, for “band”, bin is a user-defined value.
-
Advanced Settings
Lets you specify details about how memory debugging is handled on the target system.
- Runtime library
- The full path on the target to the memory-debugging library, usually $QNX_TARGET/target_architecture/usr/lib/librcheck.so.
-
Use regular file
The data will be stored in the file specified in Target output file or device field. The default is /tmp/traces.rmat. If more than one person using the same target, change the file name to be user specific, or add ${pid} as part or a name, which would be replaced by the process ID of a running process. When this option is used, the user process won't be blocked when writing data, however if data file exceeds 2G, the remaining log would be lost. For more information, see Performing a postmortem memory analysis.
-
Use streaming device
Data is collected and streamed directly to the IDE using a "device" created by qconn agent. The Target output file or device field contains the full path to the device that will receive memory events. The default is /dev/rcheck/traces.rmat. If this option is used qconn would require more memory to operate (for a data buffer) and the application will be blocked if it sends data faster than the IDE can read it. But in this case, there is no limit of the size of the data transferred to the IDE.
-
Create control thread
Enable this if you want to control data collection at runtime (such as dumping leaks or snapshots).
Note: If your program uses fork(), you can't use a control thread since fork() only works with single-threaded programs. Consequently, you must disable the control thread of the Memory Analysis tool (from the Launch Configuration, select and disable Create control thread.) -
Use dladdr to find dll names
(Deprecated) Provide backtrace information from shared objects built with debugging information.
Note: This option isn't available for the newer library file librcheck.so; however, it is available for the older file libmalloc_g.so. The availability of this option depends on which library was specified as a Runtime library. -
Show debug output on console
Enable this to show messages from the memory-debugging library in the Console view.
-
Memory Errors
- If you want the IDE to automatically change to the QNX Memory Analysis perspective when you run or debug, select Switch to this tool's perspective on launch.
- Click Apply to save your changes.
- Click Run, Debug, or Profile. The IDE starts your program and lets you analyze your program's memory.