![[Previous]](prev.gif) |
![[Contents]](contents.gif) |
![[Index]](keyword_index.gif) |
![[Next]](next.gif) |
|
|
|
|
 |
This version of this document is no longer maintained. For the latest documentation, see http://www.qnx.com/developers/docs. |
An instrumented version of the QNX Neutrino microkernel (procnto-instr) is equipped with a sophisticated tracing and profiling mechanism that lets you monitor your system's execution in real time. The procnto-instr module works on both single-CPU and SMP systems.
The procnto-instr module uses very little overhead and gives exceptionally good performance -- it's typically about 98% as fast as the noninstrumented kernel (when it isn't logging). The additional amount of code (about 30K on an x86 system) in the instrumented kernel is a relatively small price to pay for the added power and flexibility of this useful tool. Depending on the footprint requirements of your final system, you may choose to use this special kernel as a development/prototyping tool or as the actual kernel in your final product.
The instrumented module is nonintrusive -- you don't have to modify a program's source code in order to monitor how that program interacts with the kernel. You can trace as many or as few interactions (e.g. kernel calls, state changes, and other system activities) as you want between the kernel and any running thread or process in your system. You can even monitor interrupts. In this context, all such activities are known as events.
Here are the essential tasks involved in kernel instrumentation:
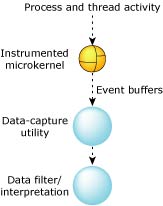
Instrumentation at a glance.
Given the large number of activities occurring in a live system, the number of events that the kernel emits can be overwhelming (in terms of the amount of data, the processing requirements, and the resources needed to store it). But you can easily control the amount of data emitted. Specifically, you can:
Once the data has been collected by the data-capture utility (tracelogger), it can then be analyzed. You can analyze the data in real time or offline after the relevant events have been gathered. The System Analysis tool within the IDE presents this data graphically so you can "see" what's going on in your system.
Apart from applying the various filters to control the event stream, you can also specify one of two modes the kernel can use to emit events:
The trade-off here is one of speed vs knowledge: fast mode delivers less data, while wide mode packs much more information for each event. Either way, you can easily tune your system, because these modes work on a per-event basis.
As an example of the difference between the fast and wide emission modes, let's look at the kinds of information we might see for a MsgSendv() call entry:
| Fast mode data | Number of bytes for the event |
|---|---|
| Connection ID | 4 bytes |
| Message data | 4 bytes (the first 4 bytes usually comprise the header) |
| Total emitted: 8 bytes |
| Wide mode data | Number of bytes for the event |
|---|---|
| Connection ID | 4 bytes |
| # of parts to send | 4 bytes |
| # of parts to receive | 4 bytes |
| Message data | 4 bytes (the first 4 bytes usually comprise the header) |
| Message data | 4 bytes |
| Message data | 4 bytes |
| Total emitted: 24 bytes |
Rather than always emit events to an external device, the kernel can keep all of the trace events in an internal circular buffer.
This buffer can be programmatically dumped to an external device on demand when a certain triggering condition is met, making this a very powerful tool for identifying elusive bugs that crop up under certain runtime conditions.
The data of an event includes a high-precision timestamp as well as the ID number of the CPU on which the event was generated. This information helps you easily diagnose difficult timing problems, which are more likely to occur on multiprocessor systems.
The event format also includes the CPU platform (e.g. x86, PowerPC, etc.) and endian type, which facilitates remote analysis (whether in real time or offline). Using a data interpreter, you can view the data output in various ways, such as:
The linear output from the data interpreter might look something like this:
TRACEPRINTER version 0.94
 -- HEADER FILE INFORMATION --
       TRACE_FILE_NAME:: /dev/shmem/tracebuffer
            TRACE_DATE:: Fri Jun  8 13:14:40 2001
       TRACE_VER_MAJOR:: 0
       TRACE_VER_MINOR:: 96
   TRACE_LITTLE_ENDIAN:: TRUE
        TRACE_ENCODING:: 16 byte events
       TRACE_BOOT_DATE:: Fri Jun  8 04:31:05 2001
  TRACE_CYCLES_PER_SEC:: 400181900
         TRACE_CPU_NUM:: 4
         TRACE_SYSNAME:: QNX
        TRACE_NODENAME:: x86quad.gp.qa
     TRACE_SYS_RELEASE:: 6.1.0
     TRACE_SYS_VERSION:: 2001/06/04-14:07:56
         TRACE_MACHINE:: x86pc
     TRACE_SYSPAGE_LEN:: 2440
 -- KERNEL EVENTS --
t:0x1310da15 CPU:01 CONTROL :TIME msb:0x0000000f, lsb(offset):0x1310d81c
t:0x1310e89d CPU:01 PROCESS :PROCCREATE_NAME
                      ppid:0
                       pid:1
                      name:./procnto-smp-instr
t:0x1310eee4 CPU:00 THREAD  :THCREATE      pid:1 tid:1
t:0x1310f052 CPU:00 THREAD  :THRUNNING     pid:1 tid:1
t:0x1310f144 CPU:01 THREAD  :THCREATE      pid:1 tid:2
t:0x1310f201 CPU:01 THREAD  :THREADY       pid:1 tid:2
t:0x1310f32f CPU:02 THREAD  :THCREATE      pid:1 tid:3
t:0x1310f3ec CPU:02 THREAD  :THREADY       pid:1 tid:3
t:0x1310f52d CPU:03 THREAD  :THCREATE      pid:1 tid:4
t:0x1310f5ea CPU:03 THREAD  :THRUNNING     pid:1 tid:4
t:0x1310f731 CPU:02 THREAD  :THCREATE      pid:1 tid:5
.
.
.
To help you fine-tune your interpretation of the event data stream, we provide a library (traceparser) so you can write your own custom event interpreters.
The IDE module of the System Analysis Toolkit (SAT) can serve as a comprehensive instrumentation control and post-processing visualization tool.
From within the IDE, developers can configure all trace events and modes, and then transfer log files automatically to a remote system for analysis. As a visualization tool, the IDE provides a rich set of event and process filters designed to help developers quickly prune down massive event sets in order to see only those events of interest.
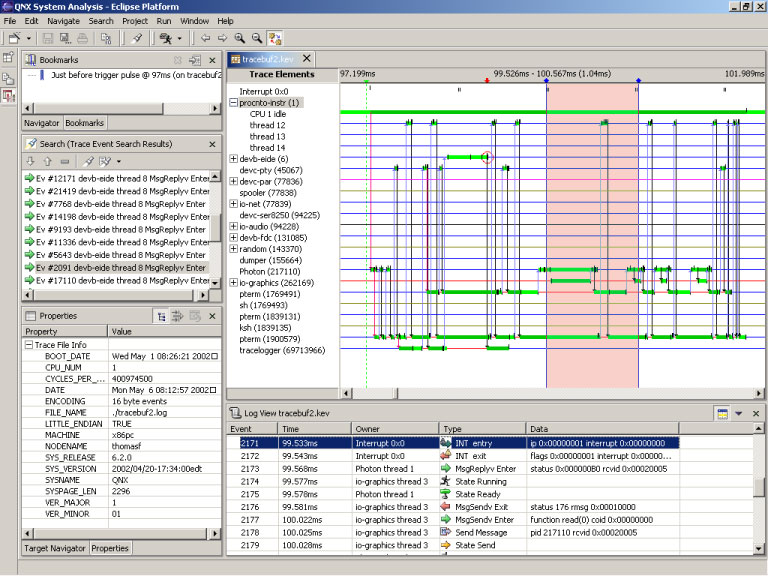
The IDE helps you visualize system activity.
While the instrumented kernel provides an excellent unobtrusive method for instrumenting and monitoring processes, threads, and the state of your system in general, you can also have your applications proactively influence the event-collection process.
Using the TraceEvent() library call, applications themselves can inject custom events into the trace stream. This facility is especially useful when building large, tightly coupled, multicomponent systems.
For example, the following simple call would inject the integer values of eventcode, first, and second into the event stream:
TraceEvent(_NTO_TRACE_INSERTSUSEREVENT, eventcode, first, second);
You can also inject a string (e.g. "My Event") into the event stream, as shown in the following code:
#include <stdio.h>
#include <sys/trace.h>

/* Code to associate with emitted events */
#define MYEVENTCODE 12

int main(int argc, char **argv) {
    printf("My pid is %d \n", getpid());

    /* Inject two integer events (26, 1975) */
    TraceEvent(_NTO_TRACE_INSERTSUSEREVENT, MYEVENTCODE, 26, 1975);

    /* Inject a string event (My Event) */
    TraceEvent(_NTO_TRACE_INSERTUSRSTREVENT, MYEVENTCODE, "My Event");

    return 0;
}
The output, as gathered by the traceprinter data interpreter, would then look something like this:
.
.
.
t:0x38ea737e CPU:00 USREVENT:EVENT:12, d0:26 d1:1975
.
.
.
t:0x38ea7cb0 CPU:00 USREVENT:EVENT:12 STR:"My Event"
Note that 12 was specified as the trace user eventcode for these events.
|
|
|
|