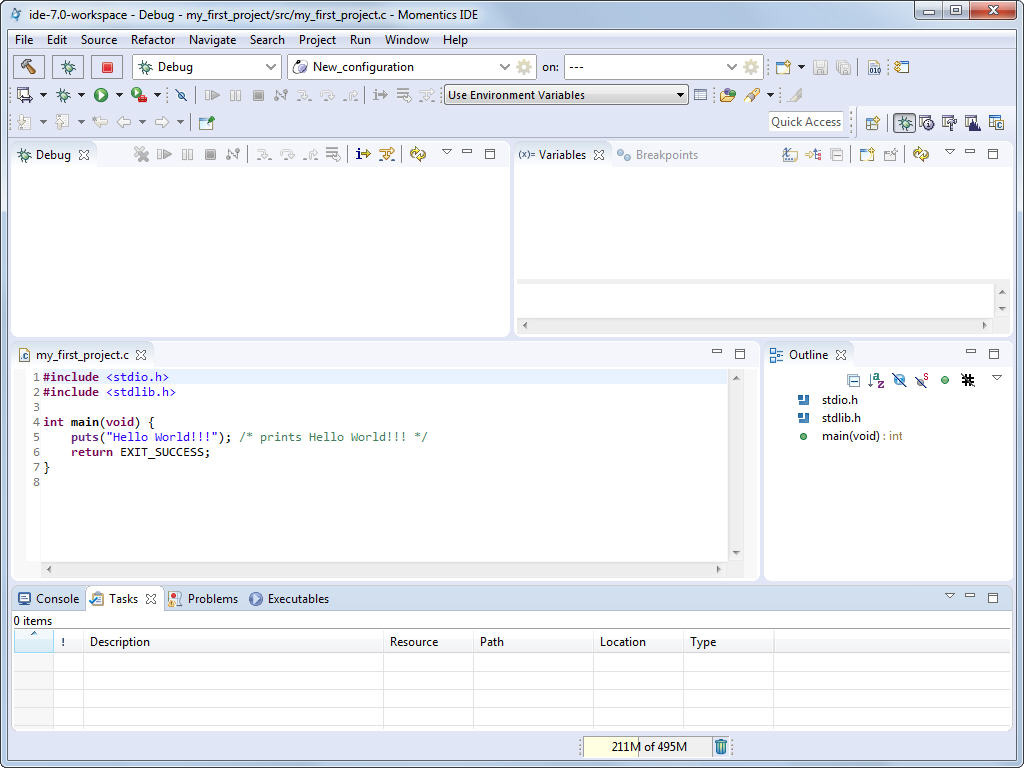
5. Running and debugging the program

Then click the Debug button in the launch bar ( ).
).
When you run or debug your application from the IDE, any input is read
from the IDE's console, and any output goes to it.
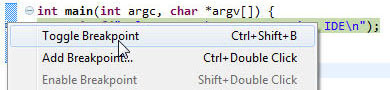
After execution has passed the line that calls puts(), you
should see the Hello World!!!
message in the
Console window.
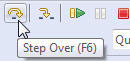
During debugging, you can watch the Variables view on the right, which displays how your variables change. You can use the Step Into button to let the debugger go into the code of a function (which, of course, is useful only if you have the source code for this function).
After the program has finished running,
you can use the Remove All Terminated Launches button
( )
to clear the information about all terminated processes from the Debug view.
)
to clear the information about all terminated processes from the Debug view.
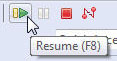
To run your program as a standalone binary (without the debugger), select Run
in the launch bar, and then click the Run button ( ).
).
You can also use the System Information perspective's Target File System Navigator view (accessible through ) to manually transfer your binary, and then run it by double-clicking on it (or by right-clicking on it and selecting Run).
It's also possible to leave the binary on a shared network drive on your development host, mount the drive on your QNX Neutrino target (see the entry for fs-cifs in the QNX Neutrino Utilities Reference), and run the binary from there.