System Resources
You can track the resource usage of target processes through the System Resources view. Specifically, this view lets you compare the CPU, memory, or file descriptor usage of different processes.
- System Uptime
- This display shows the start time, CPU usage time, and CPU usage as a percentage of total uptime, for each process. These statistics help you monitor process performance.
- General Resources
- These statistics include the relative CPU usage, data segment size, and number of open file descriptors for each process, which help you monitor resource usage.
- Memory Resources
- These statistics include the sizes of the heap and stack segments and of the code and data segments for the program and for the loaded libraries. This memory information lets you monitor memory consumption of processes.
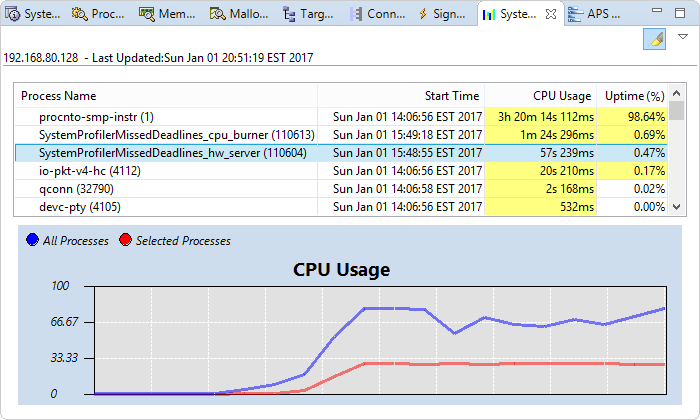
The CPU Usage graph is always shown, regardless of which statistics set is displayed. This line graph shows historical CPU usage by plotting the percentage of cycles consumed by various processes over time. By default, both the All Processes and Selected Processes lines are enabled, but no processes in the statistics table are selected. So initially, the chart shows only the total CPU consumption of all processes. You can click one or more table rows to see the combined CPU usage for multiple processes. You can also deselect one of the buttons just above the chart, to hide the corresponding graph line.