Examining interrupt handling times
In realtime systems, it's crucial to minimize the time from the occurrence of a hardware event to the execution of code that handles it. The faster a system handles events, the more time it has to meet its deadlines. The System Profiler displays a timeline of events so you can precisely measure the times for various interrupt handling activities.
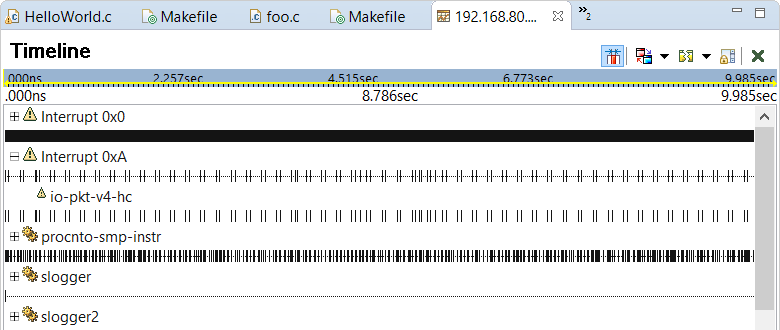
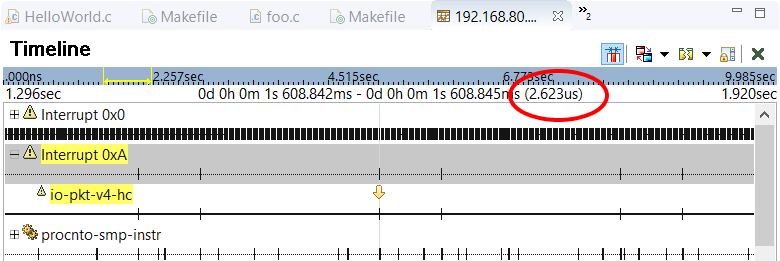
For each owner, the System Profiler draws a timeline, with individual events represented by vertical tick marks. Interrupts are listed at the top and their timelines show interrupt entry and exit events, which indicate the start and end times of the microkernel's processing of individual interrupts. If you click the plus sign (+) next to an interrupt name, the System Profiler draws timelines that show interrupt handler entry and exit events, for all attached handler functions (just below the interrupt's timeline). Above each handler timeline, the name of the process in which the function runs is given.
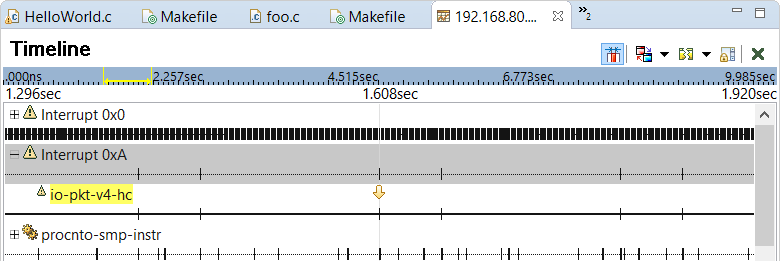
In this latest screenshot, the user has selected the Interrupt 0xA interrupt and navigated to a Handler Entry event owned by io-pkt-v4-hc. The toolbar in the upper left corner of the IDE provides buttons for navigating between events in the timeline. Because interrupt processing time is very short compared to the time period of most kernel event traces, the timeline display must be scaled, using the zoom feature, to easily distinguish events.
Here, we can see that the selected Handler Entry event for the io-pkt-v4-hc function occurs just after the Entry event following the actual interrupt on vector 0xA. The microkernel generates this first event when it starts processing the interrupt.
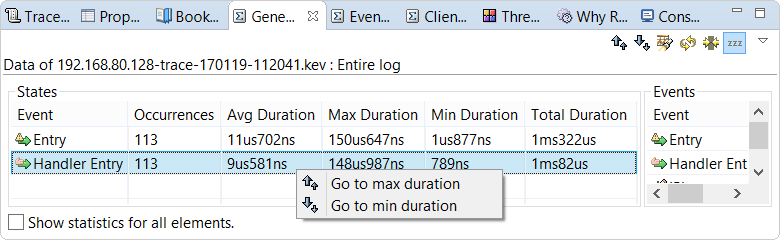
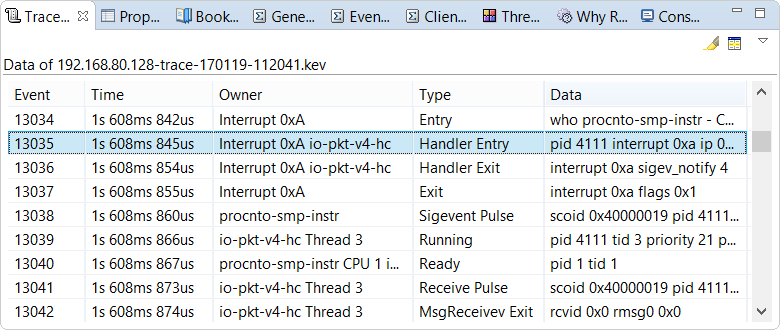
You can click the Handler Entry and Handler Exit events to measure the interrupt handler's runtime, which is just 9 us. After the handler exits and the kernel finishes processing the interrupt (as marked by the Exit event), we can see a Sigevent Pulse event, which shows that the handler has returned a pulse. This pulse evidently triggers the networking stack process, because one of its threads gets scheduled to receive the pulse (as indicated by the sequence of Running, Receive Pulse, and MsgReceiveV Exit events for io-pkt-v4-hc Thread 3).
Selecting the Handler Exit and MsgReceiveV Exit events lets you measure scheduling latency, which is the time
from the last instruction in the handler function to the start of a response by a user (i.e., non-handler) thread.
For more information about interrupt and scheduling latency,
see the Interrupt handling
section of the System Architecture guide.
Selecting the Entry and MsgReceiveV Exit events allows you to measure the end-to-end latency from the start of interrupt processing by the kernel to the response of a user thread. Here, that latency is 31 us, which proves that the interrupt handler runtime of 9 us is a relatively small part of the overall processing time. Thus, there is noticeable time needed for scheduling a thread to run and for it to receive the pulse returned by the handler.
- How long it takes for the user thread to be scheduled rather than to receive the pulse, after the handler exits. You would look for either a Ready or Running event for one of the receiving process's threads, following the Handler Exit event. The time for scheduling may differ significantly from the time for pulse processing to begin if your target system runs many threads of distinct priorities.
- How long it takes for the user thread to either be scheduled or begin reacting to the pulse, after a specific handler exits. This is relevant when many handlers are attached to an interrupt vector (which is allowed, as explained in the System Architecture guide). If multiple handlers are run, this might skew the time before an application starts handling a pulse generated by one of them.