In a running system, many things occur behind the scenes:
- Kernel calls are being made.
- Messages are being passed.
- Interrupts are being handled.
- Threads are changing states—they're being created, blocking, running, restarting, and dying.
The results of this activity are changes to the system state that are normally hidden from developers. The SAT is capable of intercepting these changes and logging them. Each event is logged with a timestamp and the ID of the CPU that handled it.
The SAT offers valuable information at all stages of a product's life cycle, from prototyping to optimization to in-service monitoring and field diagnostics.
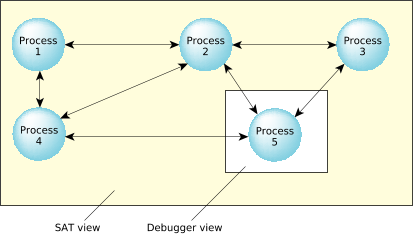 Figure 1. The SAT view and the debugger view.
In complicated systems, the information provided by standard debugging programs may not be detailed enough to solve the problem. Or, the problem may not be a bug as much as a process that's not behaving as expected. Unlike the SAT, debuggers lack the execution history essential to solving the many complex problems involved in “application tuning.” In a large system, often consisting of many interconnected components or processes, traditional debugging, which lets you look at only a single module, can't easily assist if the problem lies in how the modules interact with each other. Where a debugger can view a single process, the SAT can view all processes at the same time. Also, unlike debugging, the SAT doesn't need code augmentation and can be used to track the impact of external, precompiled code.
Because it offers a system-level view of the internal workings of the kernel, the SAT can be used for performance analysis and optimization of large interconnected systems as well as single processes.
It allows realtime debugging to help pinpoint deadlock and race conditions by showing what circumstances led up to the problem. Rather than just a “snapshot”, the SAT offers a “movie” of what's happening in your system.
Because the instrumented version of the kernel runs with negligible performance penalties, you can optionally leave it in the final embedded system. Should any problems arise in the field, you can use the SAT for low-level diagnostics.
The SAT offers a nonintrusive method of instrumenting the code—programs can literally monitor themselves. In addition to passive/non-intrusive event tracing, you can proactively trace events by injecting your own “flag” events.