The System Summary view provides information about the overall state of a target. This information includes specifications of the target machine, system-wide memory usage, and a listing of active processes that includes performance statistics.
Individual panes within the view present these different areas of information, as described below. This view is handy for monitoring memory consumption at the system level and comparing changes in CPU usage for different processes.
System Specifications
This top pane lists some of the target's hardware and software details, including the hostname, board architecture type, OS version, boot date and time, and CPU types and speeds. The CPU details are shown for each processor core.
System Memory
This pane shows the used, free, and total system memory, in numerical and graphical form.
Total Processes
In this pane, the number of active processes is displayed next to the title, while realtime statistics for process memory and CPU usage are shown in the table area below. Each table row lists a process's name and its code, data, and stack segment sizes, data segment delta, total CPU usage since starting, CPU usage delta, and start date and time. The different tabs let you see tables that list all processes, just the application processes, or just the server processes.
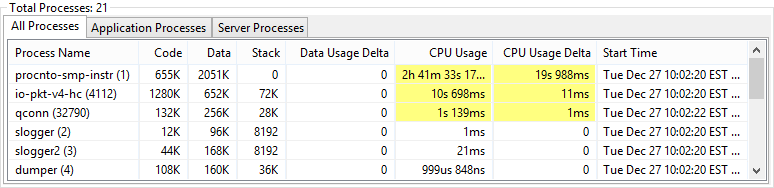
You can sort the process list by any displayed metric, by clicking the corresponding column header.
To easily spot changed values, click the highlight button
(![]() ) in
the upper right toolbar of the view. The view then colors in the cells containing any values that changed since the
last update. You can change the highlight color in the System Information preferences, by selecting
.
) in
the upper right toolbar of the view. The view then colors in the cells containing any values that changed since the
last update. You can change the highlight color in the System Information preferences, by selecting
.