You can launch an application with Memory Analysis enabled to observe the heap activity over the application's lifetime. The Memory Analysis tool reads the data sent by the debug allocation library (librcheck) and displays graphs and event information describing heap allocations and deallocations.
- Optional:
To confirm that Memory Analysis is the active tool or to adjust how it measures and reports heap usage,
you must examine the launch configuration. To do this:
-
Click the Edit button (
 ) on the right of the Launch Configuration dropdown.
- In the configuration editor window, click the Memory tab on the right to access the tool controls.
- Ensure that the Memory Analysis radio button is selected. In the fields underneath, you can set the stack trace and heap snapshot settings based on what you want to see in the results.
- Click OK to save the configuration changes and close the window.
-
Click the Edit button (
-
In the launch bar, click the Memory button
(
 ).
).
The IDE switches to the QNX Analysis perspective. If necessary, it first builds the binary. Then, the IDE uploads the binary and starts running it on the target, with librcheck loaded. When this happens, a new session is created for storing the data produced by the librcheck library; this session is displayed in the Analysis Sessions view.
The IDE also opens an editor window that shows the program's heap memory activity. The Allocations tab is selected by default and it displays two charts that illustrate the allocation and deallocation sizes for all events and for a selected subset of events.
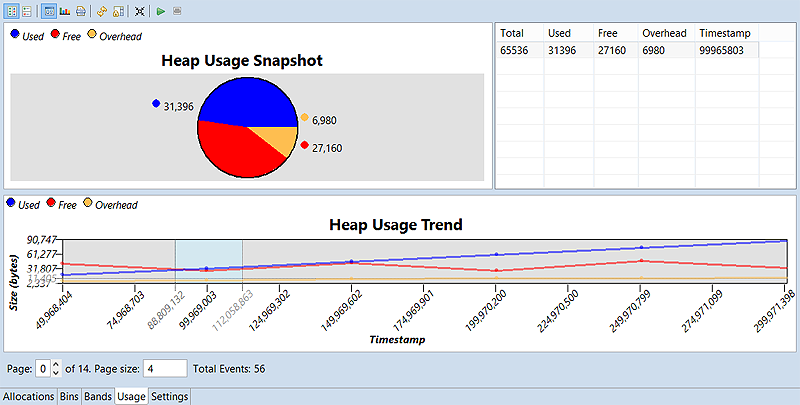
The other editor tabs display different data, such as the number of allocations within specific byte size ranges (or bins) and the usage of pre-allocated memory bands. All editor tabs are explained in full in “How to use the Memory Analysis editor”.