You can examine a process's heap through the Malloc Information view. This view illustrates heap usage and provides statistics such as allocation call counts and block counts for specific byte ranges.
Overview
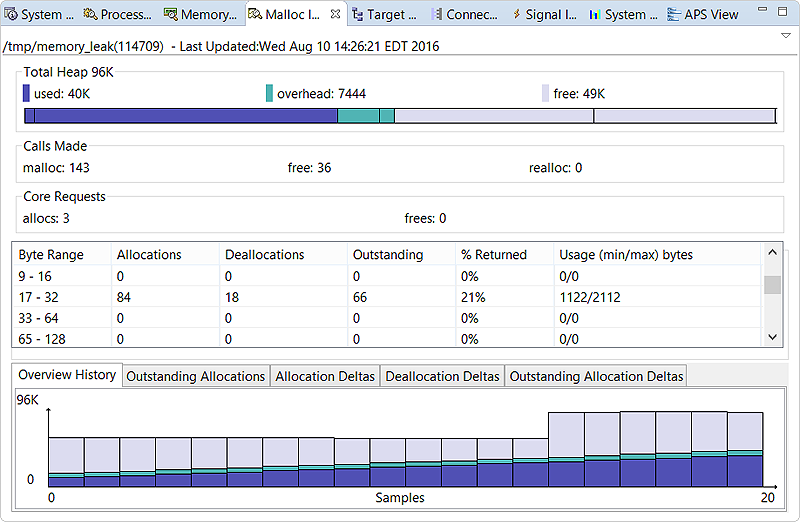
This top pane provides statistics about activity for the entire heap, in multiple panels.
Total Heap
- Used (purple)
- Overhead (turquoise)
- Free (lavender)
This bar graph quickly tells you whether the process is running low on heap space. You can hover the pointer over a section to see a tooltip stating the purpose and size of the corresponding memory area (e.g., used space for small blocks, overhead for metadata of large blocks).
The total heap size is displayed next to the title. Here, the numbers shown are exact measurements that come from the allocation library, unlike with the Memory Information and System Resources views, which display estimates.
Calls Made
The numbers of malloc(), free(), and realloc() calls made by the process are given in this panel.
Core Requests
This panel shows the number of allocations and deallocations (frees) made by the system allocator based on the program's memory requests. At startup, the allocation library reserves heap memory that isn't freed until the program terminates, so the number of allocations is always greater than the number of deallocations. Typically, the allocator dispenses memory in increments of 4 KB (one page).
Distribution
- Byte Range
- Size range of the memory blocks
- Allocations
- Total number of calls that allocated memory
- Deallocations
- Total number of calls that freed memory
- Outstanding
- Remaining number of allocated blocks. This value equals the number of allocated blocks minus the number of deallocated blocks.
- % Returned
- Ratio of freed blocks to allocated blocks, expressed as a percentage. This value equals the number of deallocations divided by the number of allocations.
- Usage (min/max) bytes
- Calculated minimum and maximum memory usage for a byte range. These values equal the number of allocated blocks multiplied by the minimum and maximum sizes of the range. For example, if the 65–128 byte range had two blocks allocated, the usage would be 130/256. You should use these values for estimated memory usage only—the actual usage typically lies in between.
If the Allocations and Deallocations counts seem high for some ranges, it means the program is allocating and freeing memory frequently, which can slow it considerably. For small blocks, this activity makes the heap overhead substantial compared to the used memory. In this case, the program is using the heap inefficiently and should be optimized.
If any Outstanding counts are increasing steadily, it means the program is allocating memory faster than freeing it, which can degrade performance. To learn about preventing leaks and inefficient heap usage, see the Heap Analysis chapter of the Programmer's Guide.
Charts
- Overview History
- Displays a timeline of the heap usage snapshots shown in the Total Heap panel. This bar graph automatically rescales as the process increases its total heap size.
- Outstanding Allocations
- Shows the total outstanding (remaining) blocks over time. Individual byte ranges are represented by distinctly colored lines. You can compare this graph with the Overview History graph to understand memory allocation trends.
- Allocation Deltas
- Illustrates the changes in allocation call counts over time. This line graph lets you observe which byte ranges have the most newly allocated memory.
- Deallocation Deltas
- Illustrates the changes in deallocation call counts over time. This line graph lets you observe which byte ranges have the most newly freed memory.
- Outstanding Allocations Deltas
- Illustrates the differences between allocation and deallocation call counts over time, for each byte range. This line graph helps you recognize when some ranges are leaking memory and by how much.