Kernel tracing is an analysis activity in which the instrumented kernel on a target logs information about kernel events. This information shows what's happening on the target at a system-wide level, so you can eliminate performance bottlenecks and optimize the interaction of processes and threads.
- kernel calls
- interrupts
- process and thread management activities
- system events related to adaptive partitioning and memory mapping
- context switches within a process
- message passing and signaling
Kernel event trace: procedure overview
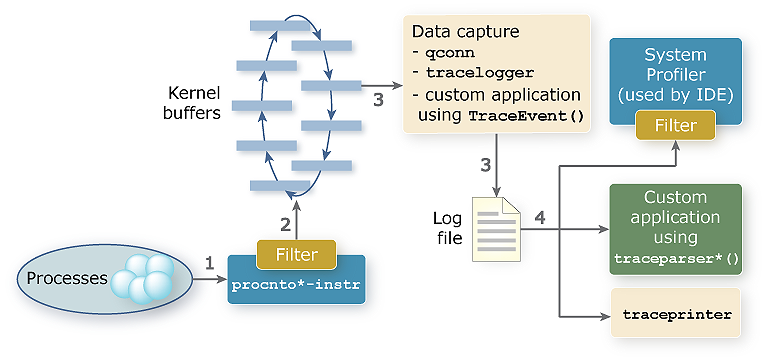
Figure 1. Kernel event trace procedure: information flow
Generating event information
The instrumented kernel (procnto*-instr) contains an event-gathering module. This module continuously generates information about the system-level activity (e.g., kernel calls or context switches) of active processes and threads. Program code can also generate such information by using the TraceEvent() kernel call.Logging of events
When requested, the instrumented kernel writes time-stamped and CPU-stamped events to a set of buffers. The default number of kernel buffers is 32, but you can set a different number in the Trace Settings tab in the Log Configurations window. Although the number of buffers is limited only by the available system memory, it's important that this space is managed carefully. If all types of events are traced, the amount of information emitted can be quite large.
You can filter the kernel events that get written, by adjusting the Event Filters fields in the log configuration. When you view trace data, you may find only some information to be relevant and decide to restrict which events get logged by the kernel. Filtering lets you run longer traces that still produce a manageable amount of data, improves system performance during tracing, and makes the trace results more readable.
When you start a trace, the IDE tells qconn, which calls TraceEvent() to tell the kernel to start writing event data to the buffers and to inform it about all trace preferences, including filters.
Capturing data
The qconn process captures event data by transferring it from the kernel buffers to the output specified in the configuration. The output is either the System Profiler (if streaming output is requested) or a local file on the target (if a target path is given).
Data capturing is done for the duration that's specified along with the output location and number of qconn buffers in the Trace Settings tab. The qconn buffers temporarily store data after reading them from the kernel buffers but before writing them to the output. You can change the number of qconn buffers from its default of 128, to find the right balance between the memory used and the amount of information that the process can hold.
Note: There's nothing in qconn that prevents data loss if it can't keep up with the kernel's writing of data.You can capture data with other tools such as the tracelogger utility found in QNX SDP. Like qconn, this other utility uses TraceEvent() to filter kernel events. You can also write a custom data-capturing application that uses this same API function, as explained in “Using TraceEvent() to control tracing” in the System Analysis Toolkit User's Guide.
Analyzing data
The System Profiler provides the best way of analyzing large amounts of kernel event trace data. When the trace finishes and all of its data have been streamed to the IDE or stored in a kernel event log (.kev) file and uploaded to the host machine, the IDE saves the data locally.
When you open a trace log file in the IDE, the editor pane displays graphical charts summarizing the captured trace data. You can change which trace statistics are shown by switching panes in the editor, and define filters to display a subset of the trace data.
In addition to the IDE, you can use the traceprinter utility (which is part of QNX SDP) to analyze trace data. This utility parses and prints the data in .kev files written by tracelogger. Also, you can write a custom application that uses the traceparser*() system calls to parse trace data so you can then print them in a convenient format, as explained in “Building your own parser” in the System Analysis Toolkit User's Guide.