When the QNX OS image is running on your target, the TRACE32 TCF plugin is installed in the IDE, and you've created a debug configuration, you're ready to debug your target using the TRACE32-ICD.
Click the dropdown arrow in the TRACE32 button (
 ) and select your debug configuration to start the TRACE32 software.
The IDE adds this button near the launch bar when you install the TRACE32 TCF plugin.
- When the TRACE32 software starts, wait until it completes execution of the startup script.
- Select .
In the list on the left, double-click Target Communication Framework to create a new configuration.
The configuration tabs appear in the main area of the window.
- Provide a unique name in the Name text field at the top.
- Click the Target tab on the left to access the fields for configuring the target for the TCF connection.
- Clear the Use local host as the target checkbox.
- In the Available targets list area, select TRACE32.
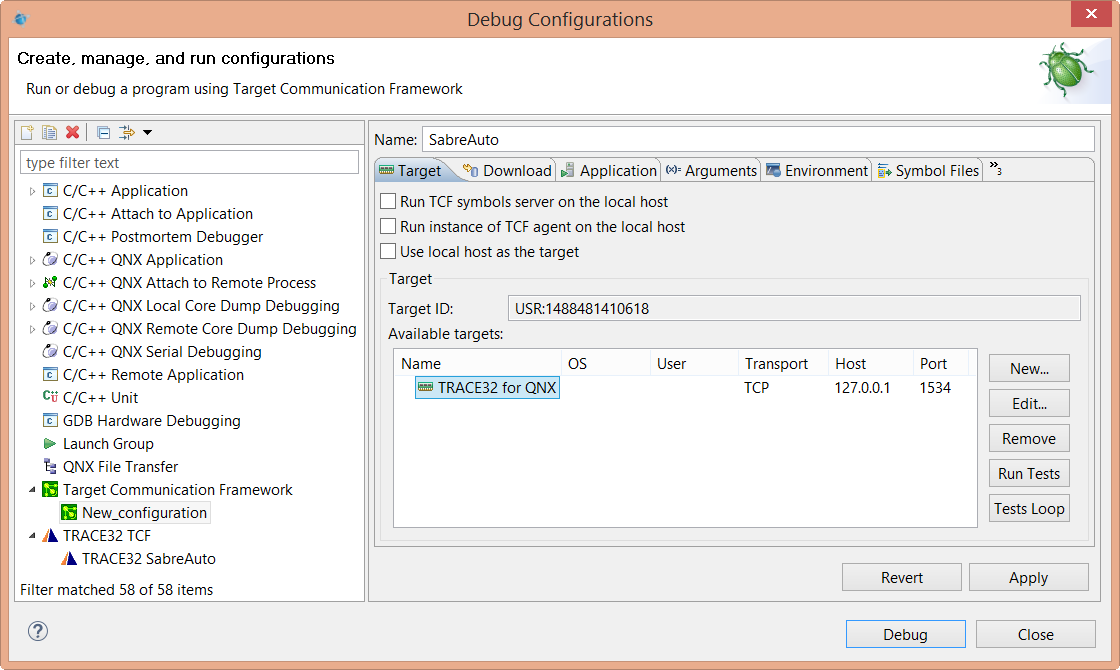
- Click Debug.
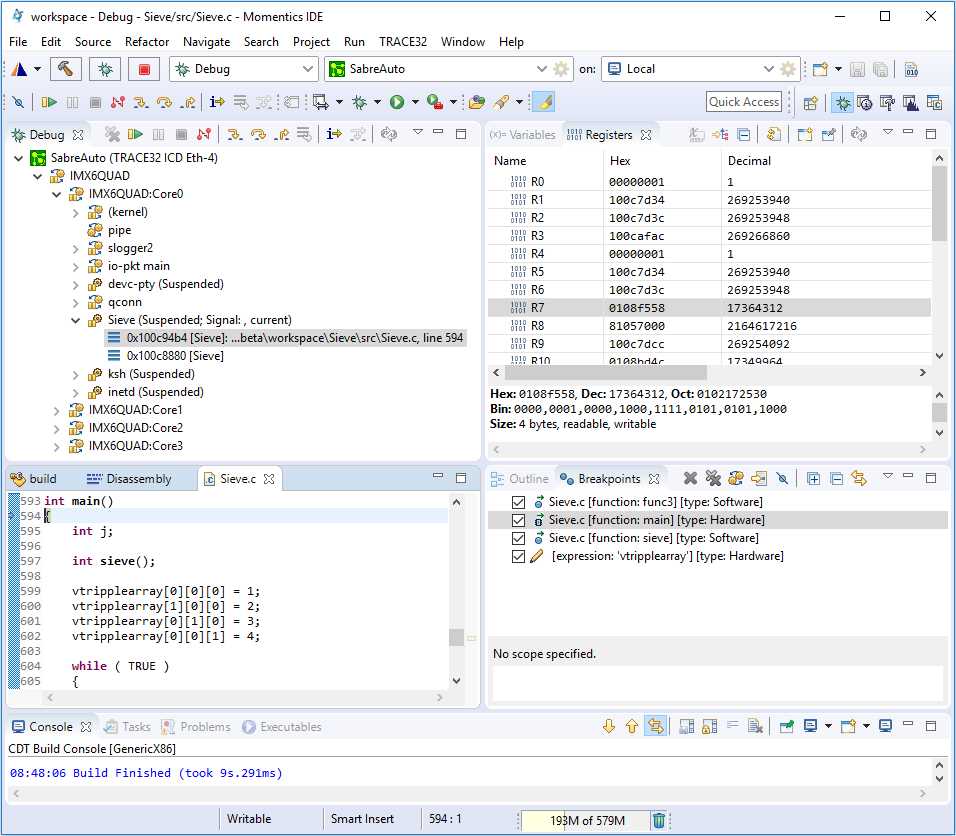
The IDE switches to the Debug perspective starts a debugging session by connecting to the TRACE32 software through the TCF plugin. The TRACE32 software controls the TRACE32-ICD module.