Valgrind Helgrind looks for memory locations accessed by multiple POSIX threads (pthreads)
but for which no synchronization mechanism (e.g., locking) is used consistently. Based on the Helgrind results,
the IDE lists the threads and memory locations involved in any such situations.
Note:
All Valgrind tools can be loaded and run
from the command line.
However, using the IDE is more convenient because it automates much of the setup by setting Valgrind command options
based on UI fields and by copying the analysis results into the host workspace.
If your target image isn't configured to include the valgrind binaries and libraries,
the IDE attempts to upload these components when you launch an application with a Valgrind tool enabled.
For this to work, the target must have a writable filesystem.
To find thread synchronization problems with Valgrind Helgrind:
-
In the launch bar, expand the Launch Configuration dropdown (which is in the middle) and select the project
in which you want to look for synchronization problems.
-
In the Launch Target dropdown (on the right), select the target for running your application.
-
In the Launch Mode dropdown (on the left), select Check.
-
Click the Edit button (
 )
on the right of the Launch Configuration dropdown.
)
on the right of the Launch Configuration dropdown.
-
In the configuration editor window, access the Valgrind controls by clicking the Check tab
on the right and then the Valgrind radio button near the top of this tab.
-
Select Helgrind from the Tool to run dropdown.
- Optional:
You can change any settings to customize what gets reported in the Valgrind results.
The Helgrind tab lets you
set how much historical data is kept about conflicting memory accesses.
-
Click OK to save the configuration changes and close the window.
-
In the launch bar, click the Check button
(
 ).
).
The IDE switches to the QNX Analysis perspective. If necessary, the IDE first builds the binary before uploading it
to the target. To analyze the application, the IDE instructs Valgrind to execute the uploaded binary with Helgrind
instrumentation. Then, it creates a session for storing the Valgrind results; this new session is displayed in the
Analysis Sessions view. When the program terminates, Valgrind writes the results to a log file,
which the IDE copies into the directory for the new session.
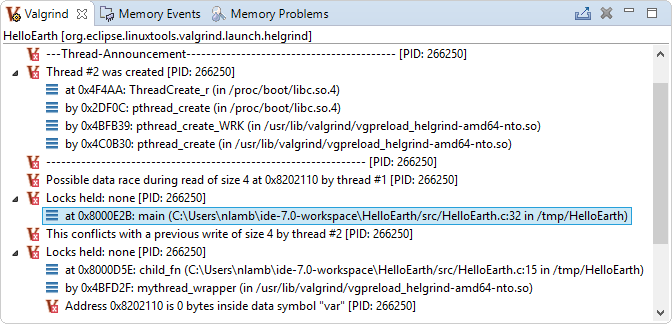
The
Valgrind view lists thread
“announcements”, which report the locations where threads
were created, and details about all detected synchronization problems. These details include the threads involved in the
conflicting accesses, the instruction addresses, source files, and lines of code where the conflicts occurred,
and the related stack traces. The
Callers in stack trace field
in the
General Options tab
determines the depth of the displayed call chains:
You should see location information for functions in shared libraries.
If you don't see this information, you must manually configure the loading of debug symbols.
If you double-click a trace line that has source file information, the IDE opens the source file at the indicated line.
This feature lets you quickly find where memory shared between threads is accessed in an unsynchronized (and hence,
dangerous) manner.
Note:
You can run multiple Valgrind sessions concurrently, using the same tool or different tools, on the same application or
different applications. Valgrind log files always contain the PIDs of the Valgrind processes, so their names are always
distinct.