The APS View displays information about the adaptive partitioning scheduling (APS) on a target.
- the Adaptive Partitioning chapter of the System Architecture guide
- the Adaptive Partitioning User's Guide
- the aps entry in the Utilities Reference
APS System Information
- current number of partitions
- partition, process, and thread IDs where the last bankruptcy (exhaustion of critical budget) occurred
- average number of computational cycles executed per millisecond
- averaging windows, which are time intervals used by the scheduler to calculate CPU usage
- APS security flags in effect, which determine who can add partitions and modify their attributes
- relative and overall times that the system was idle for longer than the second and third averaging windows (by default, these are 1 and 10 seconds)
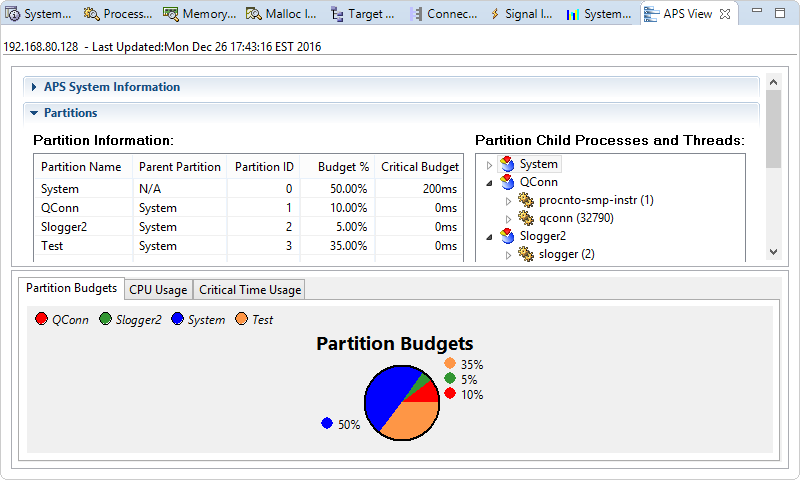
Partitions
- partition name
- parent partition
- partition ID
- budget, which is the percentage of CPU time guaranteed for the partition
- critical budget, which is the time that critical threads can run over budget
On the right, the Partition Child Processes and Threads area lists the processes and threads assigned to each partition. The list is interactive, allowing you to move processes and threads between partitions by dragging and dropping. Moving one of these items might cause others to be moved as well.
Partition Statistics
This panel displays CPU usage statistics related to the averaging windows. The table shows the relative CPU times during which threads in each partition ran for longer than the second and third windows. It also shows the total CPU times that all or just critical thread runtimes exceeded those two windows.
By default, the second and third averaging windows are 1 and 10 seconds, but you can change them by setting a new first window, through SchedCtl() or aps. The second window is set to 10 times this duration and the third window to 100 times.
APS Bankruptcy
In this panel, the Bankruptcy Information table lists the IDs of each partition's notification process and thread (which handle the event emitted when the partition exhausts its critical budget and thus, becomes bankrupt), and the IDs of the process and thread running when the last bankruptcy occurred.
On the right, the Bankruptcy Flags area lists the system's bankruptcy settings, which determine how it reacts to a bankruptcy. You can change the bankruptcy settings through SchedCtl() or aps.
Partition and CPU usage graphs
- Partition Budgets
- This piechart shows the partition budgets, which are the percentages of CPU time assigned to the partitions.
- CPU Usage
- This line chart shows recent CPU usage for each partition.
- Critical Time Usage
- This line chart shows critical time usage for each partition, which refers to the time (in milliseconds) that critical threads within a partition ran over budget.