Once the data has been captured, you may process it, either in real time or offline.
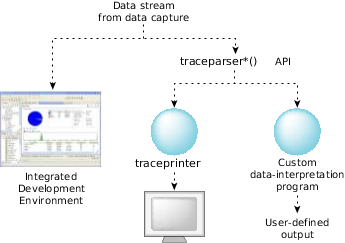 Figure 1. Possible data interpretation configurations.
The best tool (by far) for interpreting the copious amounts of trace data is the Integrated Development Environment. It provides a sophisticated and versatile user interface that lets you filter and examine the data. For more information, see the Analyzing Your System with Kernel Tracing chapter of the IDE User's Guide.
We also provide a traceprinter utility that simply prints a plain-text version of the trace data, sending its output to stdout or to a file.
You can also build your own, custom interpreter, using the traceparser library.