You should still be in the Debug launch configuration dialog. You just created a configuration for launching your program, which you now can start in the debugger. To do this, please click Debug.
The IDE now switches to the Debug perspective and transfers your program from your development machine across the network to your target QNX Neutrino system, and then starts it under the control of the debugger. You will see that the debugger stops in the first line of your program. In the Debug view, you'll see an overview of your process, including the call stack. Using the buttons in the main bar of the Debug view, you can control the debugger.
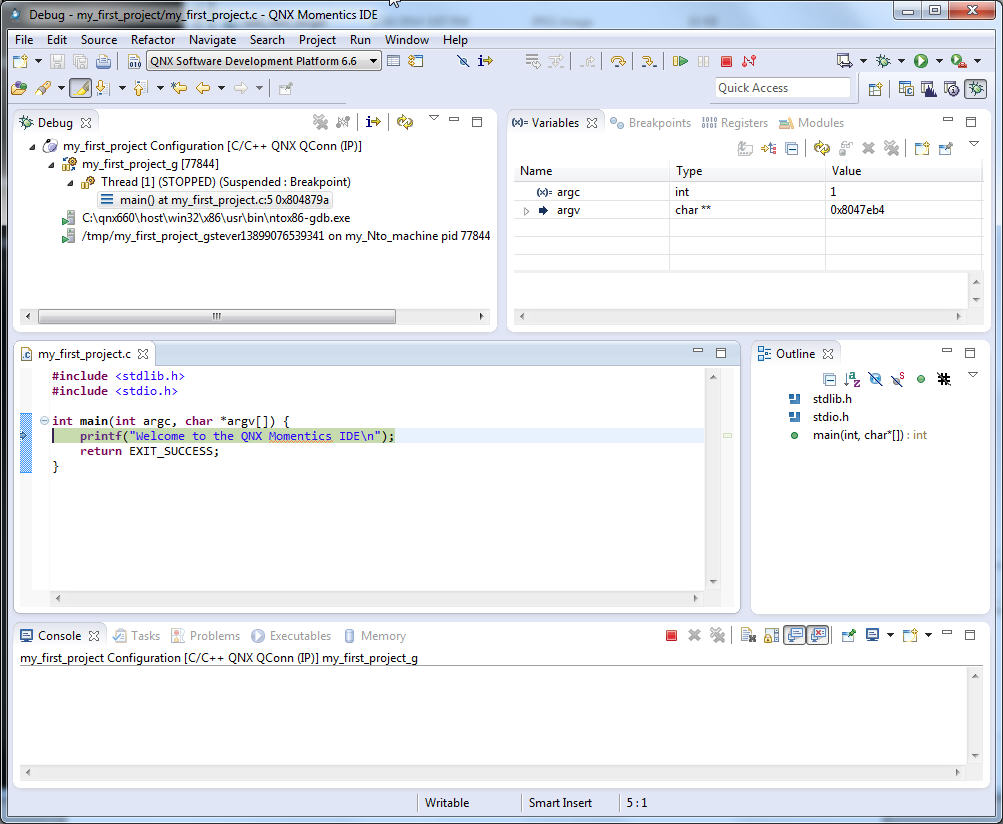
When you run or debug your application from the IDE, any input is read from the IDE's console, and any output goes to it. Once execution has passed the line that calls printf(), you should see the "Welcome to the QNX Momentics IDE" message in the Console window.
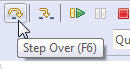
Using the Step Over button, you can jump to the next line of code:
During debugging, you can watch the Variables view on the right, which displays how your variables change. You can use the Step Into button to let the debugger go into the code of a function (which, of course, is useful only if you have the source code for this function).
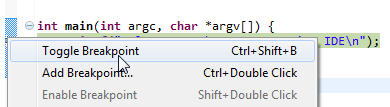
To set a breakpoint, place the mouse pointer over the left border of the source display, press the right mouse button and choose Toggle Breakpoint from the context menu. The breakpoint is shown as a little circle, which you can also set or remove while you write your code.
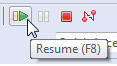
When the running program hits a breakpoint, it stops in the debugger, and you can, for example, examine your variables. If you click the Resume button, your program continues until it hits the next breakpoint:
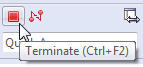
To abort program execution, use the Terminate button:
After the program has finished running, you can use the Remove All Terminated Launches button to clear all terminated launches from the Debug view:

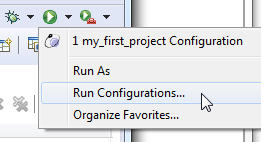
To run your program as a standalone binary (without the debugger), open the dropdown menu beside the Run icon and choose Run Configurations... :
Then you can use the launch configuration (described in the previous step) to start your program. Or create a new launch configuration and select the binary without debug information. You can also use the System Information perspective's Target File System Navigator () to manually transfer your binary, and then run it by double-clicking on it (or by right-clicking on it and selecting Run).
It's also possible to leave the binary on a shared network drive on your development host, mount the drive on your QNX Neutrino target (see the entry for fs-cifs in the QNX Neutrino Utilities Reference), and run the binary from there.