Often, high CPU load is traced back to server activity. Sometimes, what's required to reduce this CPU load isn't to make the servers more efficient but to look closely at the client activity that's making the servers very busy.
Requirements
In addition to the RUNNING thread state, the log must contain the SEND/RECEIVE/REPLY|ERROR communication events. These events establish the relationship between clients and servers.
Procedure
QNX Neutrino systems rely heavily on client/server communications
most often performed through message passing. In these systems, clients send
requests to servers asking them to do work on their behalf, as shown in this
example:
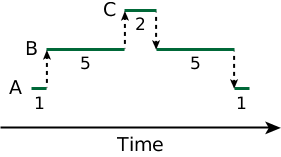
Here, A's real CPU usage would be considered as 2 units of time, B's as 10, and C's as 2. Because B and C are both acting as servers, they really execute only when there are clients generating requests for work. Most standard CPU Usage metrics don't take this type of "on-behalf" work into consideration. However, if the goal of a kernel log file investigation is to locate the sources of high CPU load, then this type of metric is quite helpful in assigning blame for high CPU usage.
The System Profiler offers the Client/Server CPU Statistics view to help extract this type of on-behalf metric. This view is shown by default, but you can manually activate it via the menu option . Once activated, the Client/Server CPU Statistics data is gathered on demand, by default, targeting the full time range of the log file.
- the thread is executing code for itself (Self Time)
- other threads are executing code on its behalf (Imposed Time)
- the sum of these two times (Total Time)
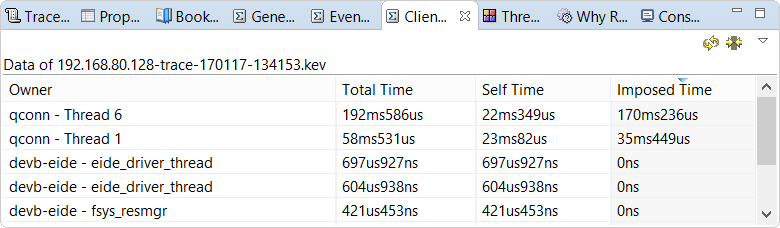
In this case, it's clear that the qconn- Thread 6 thread isn't consuming much
CPU on its own, but is imposing a significant CPU load on the system indirectly.
If you compare this data to the data shown in the CPU Usage editor pane, you'll see the
difference in what's reported:
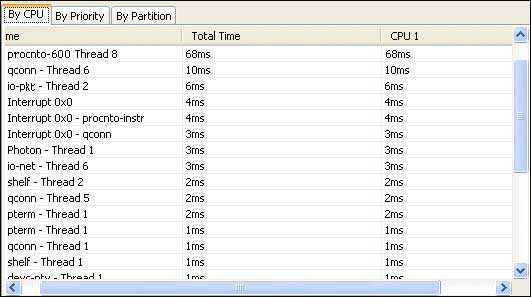
In the CPU Usage table, procnto-600 Thread 8 ranks ahead of qconn- Thread 6 in its usage. However, procnto is a pure server process, so it consumes no CPU resources without being solicited to do so. It's likely, then, that qconn- Thread 6 is imposing a significant load on the procnto thread.
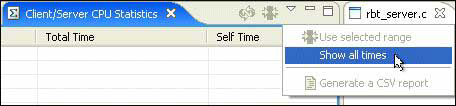
You can confirm this suspicion by looking at which servers qconn- Thread 6 is
imposing CPU usage on. You can configure the Client/Server CPU Statistics view to
display all server threads that are being imposed on by particular client threads,
by clicking Show all times in the view's dropdown menu:
The Client/Server CPU Statistics view changes to show all of the "imposed-on"
servers that clients are communicating with. The clients are listed in the
Owner column and each server is given its own column, to indicate
the amount of time each client imposes on it. The resulting table may then have many
columns:
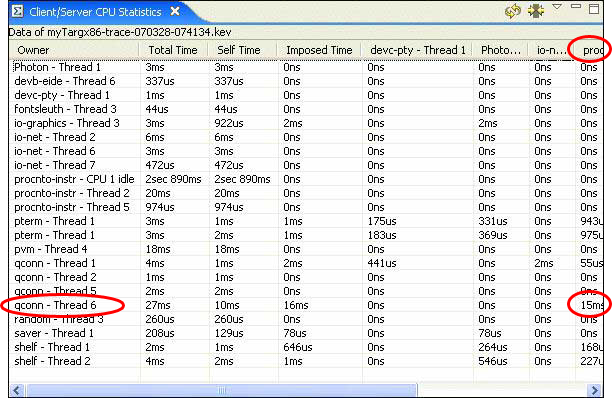
Here, you can see that nearly all of the CPU time for procnto-600 Thread 8 (whose entry is the rightmost column, just visible in the screenshot above) is due to requests coming from qconn- Thread 6.
This is to be expected, since in order to query the system, the qconn process must communicate with the kernel to extract the system state and all process and thread information.