- time from the hardware signal generation to the start of software processing
- time it takes to invoke a non-OS control function in response to the interrupt
- time it takes to activate a user thread in response to this type of external event
The System Profiler, as a type of software analyzer, helps you look at the timing of activities after the interrupt has been acknowledged by the OS. To accurately measure the time between signal generation and acknowledgment, you need additional hardware tools.
Requirements
To measure interrupt service time—the time for the OS to acknowledge the interrupt, handle it, and return to normal processing, you must log the QNX Neutrino Interrupt Entry/Exit events.
If you're interested in the time from the OS's acknowledgment to when an ISR runs, you need to capture the Interrupt Handler Entry/Exit events in the log file also.
To properly gauge the latency in triggering a response in user code, you should log the QNX Neutrino READY and RUNNING thread states, in addition to the communication PULSE events, since these are often used to trigger a user application's interrupt response.
Procedure
Interrupt activity is best viewed in the System Profiler editor using the Timeline pane. To do so,
open the log file, and in the editor, switch to the Timeline pane via the menu item , or the editor's dropdown menu for switching panes
(![]() ).
).
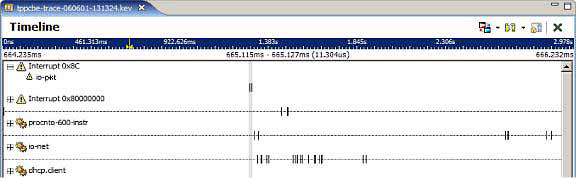
You should see a display like the following (with the same layout but different details):
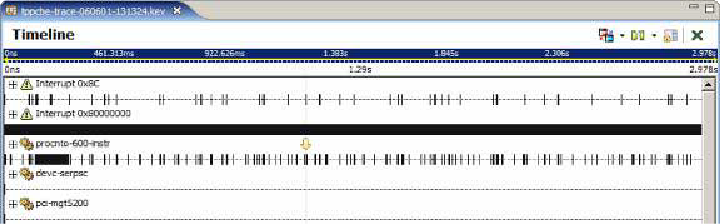
This display shows the various event owners or sources, which include interrupts, interrupt handlers, processes, and threads, as a tree with their associated events arranged horizontally on their own timelines.
If you've logged Interrupt Handler Entry/Exit events, then you can expand the interrupt entries to show the various handlers
(more than one handler can be attached to an interrupt source), as shown here:
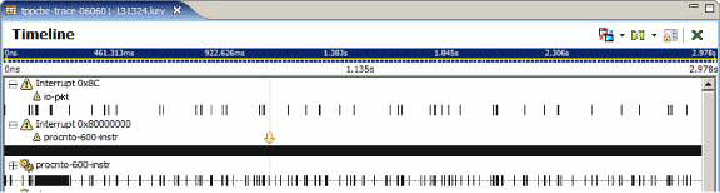
Here, you can see that the io-pkt process has attached to Interrupt 0x8c and that procnto-600-instr has attached to Interrupt 0x800000000, which on this system is the timer interrupt firing once every millisecond or so.
You can use the General Statistics view to determine how many interrupt events occurred over the log period.
This view is part of the default QNX System Profiler perspective, and you can also access it via .
If you click the refresh button (![]() ), the view refreshes
to show the event statistics for the entire log file (default) or for only the area you've selected:
), the view refreshes
to show the event statistics for the entire log file (default) or for only the area you've selected:
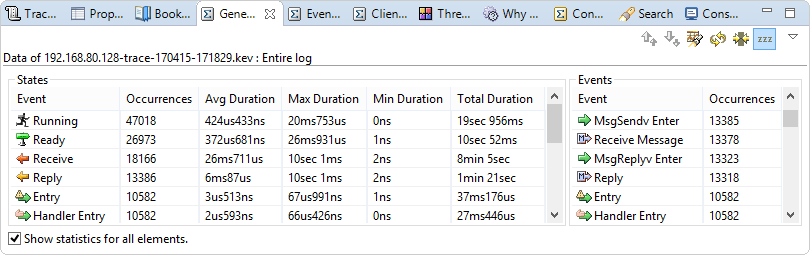
The displayed table provides a breakdown for all event sources, showing the number of raw events and the average, maximum, minimum, and total duration of the various thread states over the log period.
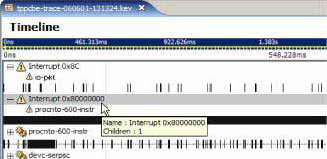
If you're interested in only the events associated with the timer interrupt (Interrupt 0x80000000), you can select
that event owner in the Timeline pane:
Next, uncheck the Show statistics for all elements box at the bottom of the General Statistics view. The tables in this view will show the statistics related to just the selected event owners.
You can navigate directly to the timeline markers for events with maximum and minimum times, where you can look at the exact timing sequences. To do this, select one of these entries in the States table, then right-click and choose Go to max duration or Go to min duration, or use the equivalent toolbar buttons, to jump directly to the selected event.
To look at the timing sequence of an interrupt, you usually have to zoom in on the timeline a significant amount to achieve an
get enough visual detail, since interrupt processing time is typically minimal compared to the entire log period.
If you zoom into an area where, say, a networking interrupt is being processed, the Timeline pane will change to look like this:
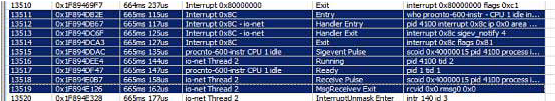
At this level of granularity, it also helps to see the Trace Event Log view concurrently with the Timeline pane. This view is part of the default QNX System Profiler perspective, and you can also access it using . The Trace Event Log view and the Timeline pane are synchronized; when you move your cursor in the editor area, the selection in the view also changes.
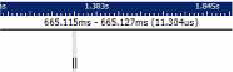
Suppose you select the Interrupt 0x8c Entry event through to the Interrupt 0x8c Exit event.
This represents the start to end of the processing of the interrupt event. In the timeline display, this selection is made and
a timing measurement of 11.304 microseconds is displayed:
So the total interrupt handling time from start to end of the OS's ISR, including the event-handler, was 11.304 microseconds. If you look at just the time for the interrupt-handler attached by the io-pkt process, you can see that it's only 8 microseconds.
You can also see that the io-pkt interrupt-handler is returning a pulse that's triggering something in
the user application, and that an io-pkt thread is then scheduled to service that request.
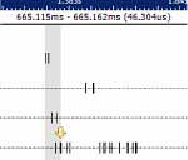
You can measure this latency to determine the time from OS awareness of the interrupt to the application's processing of it,
using the same selection technique:
There are many different time ranges that may be of interest. Suppose you decide to measure the time from when the
OS becomes aware of the interrupt (event 13511) to the time when the user process starts responding to the signal generated by
the io-pkt interrupt-handler. Because this handler communicates using a pulse (event 13515), the earliest
point at which the user process can respond is when the MsgReceive kernel call exits (event 13519) with the
received pulse. In this case, you can see that this end-to-end latency is 46.304 microseconds:
- The time for the user-level interrupt-handler to be scheduled rather than the time for it to start running. This is signified by a transition of a thread in the receiving process (io-pkt) into either the READY or RUNNING state (e.g., event 13516 in the table screenshot above). This time may differ greatly from the actual start of the processing time in systems with many processes of mixed priorities.
- The time between the end of a specific interrupt-handler's execution and the awareness by the user-level process (either the scheduling or the start of processing) of the interrupt occurrence. This timing can be quite relevant when there are multiple ISRs sharing the interrupt, which may skew the time before the user-level interrupt-handler starts running.