The IDE lets you import the selected portion of a kernel trace into the Application Profiler tool.
(However, you can import the entire trace if required.) This means that the Application Profiler considers only a single process
from the trace; it chooses the process for the executable file selected by the user.
To import part of a kernel trace into the Application Profiler:
-
Highlight the area of interest in the Timeline view, by clicking and dragging the mouse over the appropriate
time range.
-
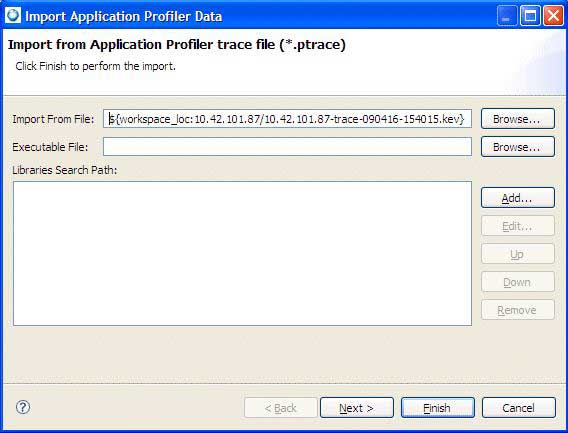
Right-click and select Open with QNX Application Profiler.
The Import dialog is displayed:

-
In the Executable File field, specify the binary file for the process whose data
you want to import.
You can enter the file manually in the text field or click Browse to navigate to and choose a
file using a file selector.
- Optional:
If the source code for the executable file wasn't compiled on the same host, click Next
to advance to the Binary Path dialog. Otherwise, skip to
Step 6.
- Optional:
In the Source Lookup Path area, select a search path for finding debug symbols
for the source code.
-
Click Finish.
The IDE opens the Application Profiler perspective, which displays the event data for the
selected file.