It is important to know how much memory individual processes use, otherwise you can spend considerable time trying to
optimize the heap. You can use the QNX System Information perspective to inspect the distribution and overall memory usage
for each process.
Note: To use this view, you must first create a target project and connect
your target machine to the host machine and enable IP communications.
To inspect a process's memory distribution:
-
Switch to the QNX System Information perspective by clicking its icon
(
 ) in the toolbar.
-
On the All Processes tab, select a process.
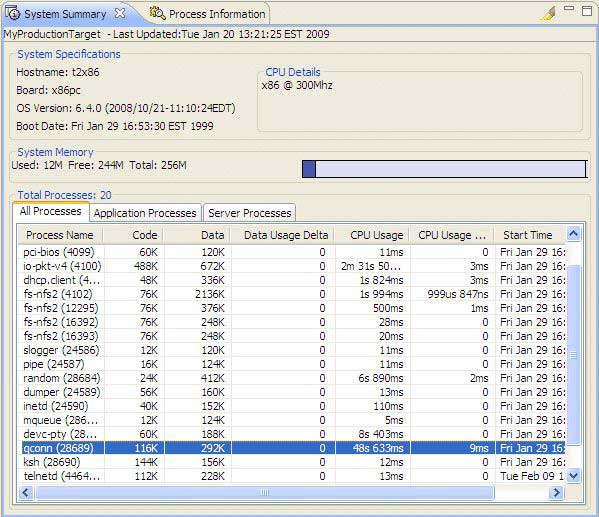
The process's row is highlighted and you can easily see how much physical memory the selected process occupies; in this example, it is 116 KB of Code and 292 KB of Data.
-
In the Target Navigator view, expand your target and select the same process you selected earlier.
You can see a detailed map of the process's virtual memory:
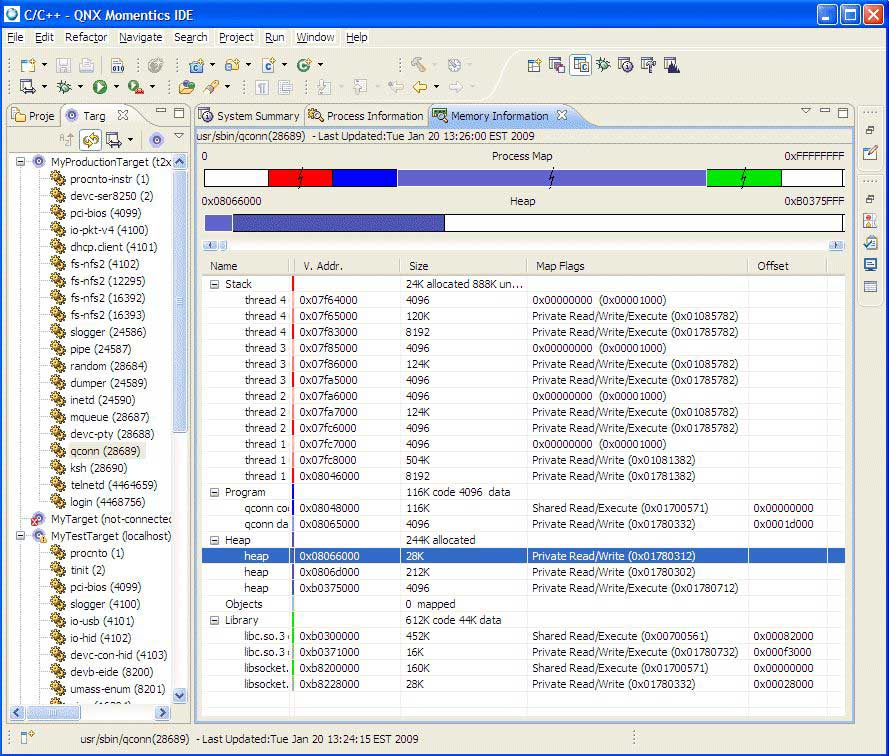
Based on the memory distribution data shown in these views, you can decide if it is worth your time to optimize
the heap memory. If not, you might consider optimizing the stack or static memory.