You can import profiling data from results files generated either by applications launched from the
IDE or by applications or kernel event traces that ran on a QNX target.
Often, the files containing profiling data are already on the host machine, because you obtain them from either the IDE
or other team members who share session results.
If you run a binary with profiling instrumentation from the command line, when the program finishes, you must copy over the
results file to the host by using the
Target File System Navigator.
For kernel event traces, if you run them from the IDE, the log file automatically gets copied over.
If you run them from the command line (i.e., using
tracelogger), you must copy the log file to the host
using that same mechanism.
To import profiling data:
-
In the Profiler Sessions view, click the Import Application Profiler Session icon
(
 ) in the toolbar, or right-click within the view
and choose Import.
) in the toolbar, or right-click within the view
and choose Import.
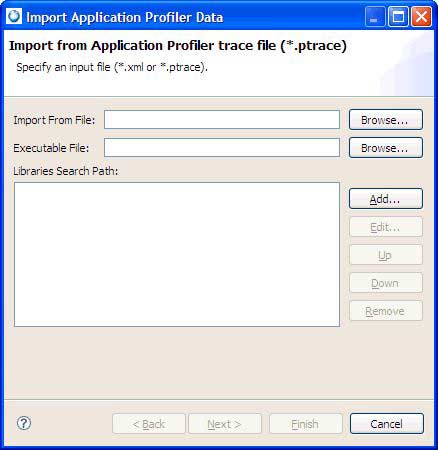
The IDE displays the Import Application Profiler Data window:
-
In Import From File, specify the file containing the profiling data that you're
importing.
You can enter an absolute host path or click Browse to open a window
that lets you choose a workspace file or local file, using a file selector. In the file's name,
you can use ${workspace_loc:*} to specify the current workspace; for example:
${workspace_loc:project_name/results_file}.
In the file selector, you can pick a file with one of these naming conventions:
- gmon.out.* — for position sampling and call count data
- *.ptrace — for function runtime measurement data
- *.kev — for kernel event trace logs containing profiling data
- *.xml — for profiling sessions that were exported from the IDE
If you select an XML file, the remaining fields in the window are greyed out and you can skip to
Step 6.
-
In Executable File, specify the application binary that produced the profiling results.
Like the previous text field, you can manually enter a file path or click Browse to pick a file
from the workspace or filesystem through a file selector. The ${workspace_loc:*} variable is also
supported.
-
In the Libraries Search Path panel, add the paths of any libraries that the application uses.
These paths tell the IDE where to find shared libraries or DLLs referenced by the profiling data.
This UI control behaves the same way as the Shared Libraries tab in the launch configuration.
When you've defined the necessary paths, if the profiled application uses source code compiled on another machine,
click Next; otherwise skip to Step 6.
- Optional:
In the Binary Path dialog, specify any additional required source code paths.
The
Source Lookup Path panel lists the host paths where the IDE can find source code
that was part of the instrumented binary but wasn't compiled on the host.
This UI control behaves like the
Source tab in the
launch configuration.
-
Click Finish.
The IDE begins importing the data into a new Application Profiler session, which it displays in the
Profiler Sessions view. The session follows the standard naming convention, meaning it includes
a new, unique session number.
When the import operation finishes, you can view the results from the earlier profiling activity by examining the
Execution Time view, which is populated with the new session's data.
If you're importing data from a kernel event trace log, the IDE doesn't display the trace statistics in the editor;
it just shows the profiling data for any instrumented binary that ran during the trace.