To test a running process for memory leaks:
-
Switch to the QNX System Information perspective by clicking its icon
(
 ) in the toolbar.
- In the Target Navigator view, select the target process you want to examine.
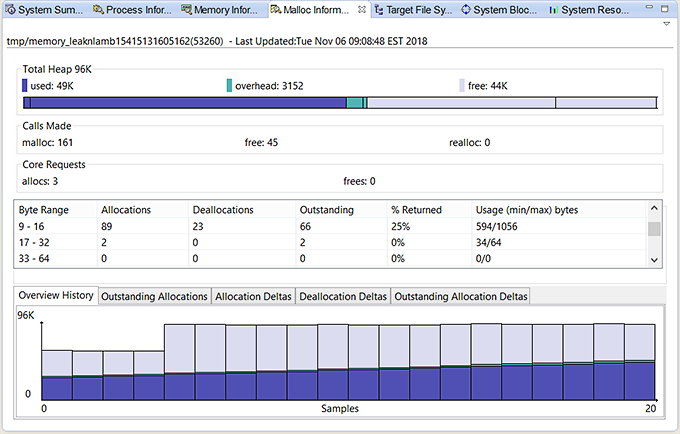
- Switch to the Malloc Information view to compare memory usage at specific times.
- Watch for increases in the Outstanding column values, or in the graph in the Overview History tab.
In the example below, notice the steady growth in the Overview History chart. If the memory usage
continues to increase over time, then the process is not returning some of the allocated memory.
Since memory leaks can be apparent or hidden, to know exactly what's occurring in your program, use the Memory Analysis tool to automatically find the apparent memory leaks. For information about these types of leaks, see Memory leaks.