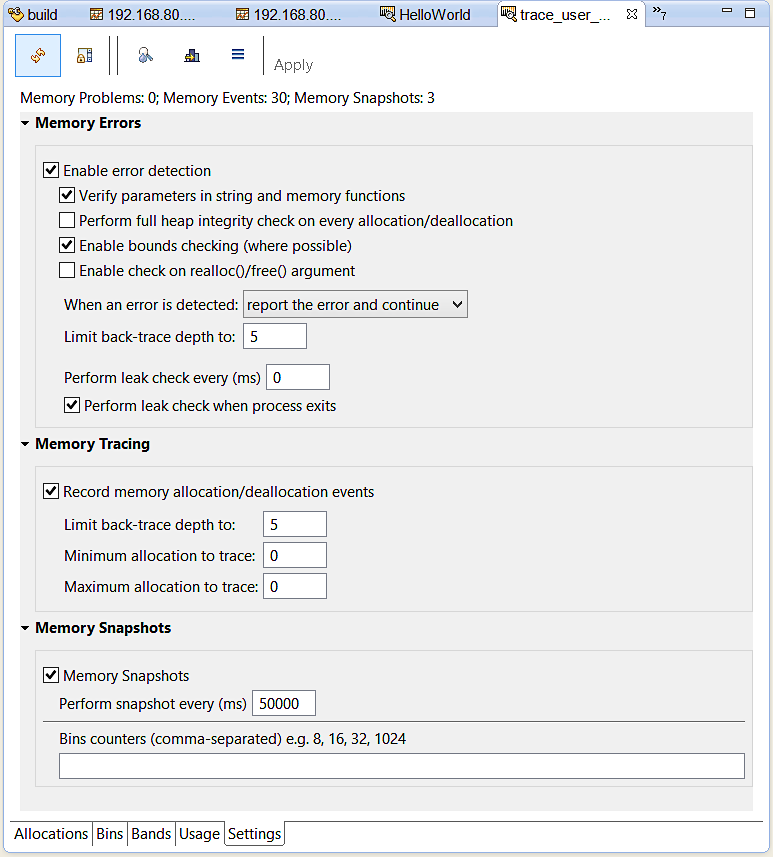
You can configure most Memory Analysis settings for a running program from the
Settings tab:
Icons
| Icon | Description |
|---|---|
|
|
Update the current display with the latest data. |
|
|
Determine whether the IDE automatically refreshes the display when streaming data from the target. When selected, you need to click Refresh to update the display. |
|
|
Gather information about any memory leaks encountered. |
|
|
Take a snapshot of the current results. |
|
|
Obtain a stack trace. |
Field descriptions
For a description of the Memory Errors, Memory Tracing, and Memory Snapshots fields, see Configuring Memory Analysis sessions.