Use this view to show the memory events (allocation and deallocation) that are found in your program by the
Memory Analysis tooling.
To populate the view, click on a session or session element (such as a thread, file, and so on) from the Session view, or activate the Memory Analysis editor, and then select a region in the allocations chart (when the view is synchronized).
If you want to capture the memory error data and review it outside of the IDE, press Ctrl–A to select all of the information in the table, then Ctrl–C to copy it as text to the clipboard.
| Column | Description |
|---|---|
| Expand | When events are grouped, clicking the arrow in this leftmost column toggles between displaying a summary row or all events in the group. |
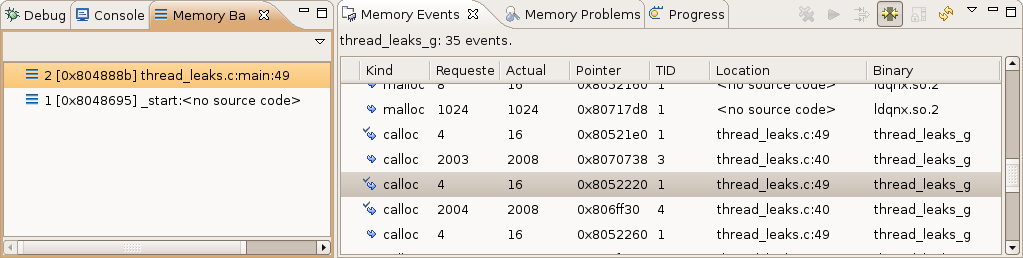
| Kind | A kind of allocation or deallocation (malloc, calloc, new, free, etc) with a matched icon (see the list below for an explanation of the possible icons). |
| Requested | The size of memory in bytes requested. |
| Actual | The size of the memory block allocator used. |
| Pointer | A pointer value. |
| Time Stamp | The timestamp of an allocation or deallocation (these values can wrap around). |
| PID | The process ID. |
| TID | The thread ID of thread that did the allocation. |
| CPU | The CPU on which the allocation or deallocation occurred. |
| Event Id | The unique ID in the order of appearance. |
| Binary | The binary or library name of the requester (the top frame of a backtrace). |
| Location | The file:line of the requester (the top frame of a backtrace). |
| Count | When grouped, it's the count of the grouped allocations. |
| Average Size | When grouped, it refers to the average size of the requested allocations. |
| Max Size | When grouped, it's the maximum size of the requested allocations. |
| Sum Size | When grouped, it's the sum of the sizes of the requested allocations. |
- Show full file path — Show the full file path in the Location column. The default is to show only the base name.
- Max rows — Limit the maximum amount of rows displayed. For performance purposes, a limit of 1000 is recommended; however, if you have more rows, you can use grouping or filtering to reduce the number.
-

- An allocation with a matching deallocation.
-

- A deallocation with a matching allocation.
-

- An allocation without a matching deallocation.
-

- A deallocation without a matching allocation.
Non-aggregate columns show data for the first event in the group, when the events are grouped. You can resize, hide, and rearrange columns using standard drag-and-drop options on the table header. To hide the column, resize it to none. To make a column more visible, use the Preferences… dialog.
- Double-clicking a particular event entry makes the IDE highlight the corresponding source code line (if it exists) in the editor.
- Clicking an entry makes the IDE update the backtrace in the Memory Backtrace view.
- Clicking a column header sorts the data by that column value.
- Dragging and dropping columns by their header rearranges the column order.
- Pressing Ctrl–C makes the IDE copy the text representation of the selected events to the clipboard.
- Double-clicking the view header maximizes the view (or returns it to normal when it's maximized).
View toolbar
- Remove Events — remove (by filtering) the current events from the view. This is enabled when the program is running.
- Start/Stop memory tracing — Start or stop the memory tracing.
- Open Filter Dialog — open the Filter dialog (see the description in Memory Events Filter).
- Synchronize with Editor Selection — when enabled, the view shows the selection details from the editor Allocations tab, and uses the editor filters.
- Prevent Auto-Refresh — don't perform a refresh automatically. This is enabled when the program is running.
- Refresh — force a refresh.
There are also the standard buttons for accessing the view menu and minimizing and maximizing the view. The view menu has the same Filter, Synchronize with Editor, Group By, and Preferences options as the context menu, for which all of the options are described below.
Context menu
- Filter... — opens the traces filter (see the description in Memory Events Filter below).
- Find matching event
-
Quick Filter
- Matching with Event — show only this event and the matching event (the allocation and deallocation pair).
- From Event — show only events from this event (by time occurrence).
- Up to Event — show only events up to this current event (by time occurrence).
- Same pointer — show only events that have the same pointer.
- Same size — show only events that have same size of allocation.
- Same band — show only events that are allocated in the same band.
- Same backtrace — show only events with the same allocation backtrace.
- Show All — reset the filter (show all events).
- Copy — copy the data from the selected events to the clipboard.
-
Group By
- None — no grouping is performed in the view.
- Kind — group by allocation kind (e.g. malloc, calloc, etc.)
- Size — group by the requested size.
- Band Size — group by band size (events from the non-band allocator aren't grouped).
- Pointer — group by the same pointer.
- Backtrace — group events with the same backtrace under one group. For the group row ,non-aggregated columns show the value of the first entry.
- Thread — group by thread ID.
- Show Backtrace — activate the Memory Backtrace view and show the current backtrace in the view.
- Show Source — show the context menu and double-click to select an event source location.
- Preferences... — open the view Preferences dialog to set the column selection and order.