- Support for Mudflap has been removed in the upstream FSF gcc, and therefore future releases of the QNX Neutrino version of gcc won't support it either.
- If your binary is instrumented with Mudflap, you can't run Memory Analysis on it because there will be a conflict trying to overload the same functions, which will cause the program to crash.
Mudflap provides runtime pointer checking capability to the GNU C/C++ compiler (GCC). Since Mudflap is included with the compiler, it doesn't require any additional tools in the tool chain, and it can be easily added to a build through GCC options.
Mudflap instruments all risky pointer and array dereferencing operations, some standard library string/heap functions, and other associated constructs with range and validity tests. Instrumented modules detect buffer overflows, invalid heap use, and other kinds of C/C++ programming errors. The instrumentation relies on a separate runtime library (libmudflap), which gets linked into a program when the right compile option (-fmudflapth) is provided for the build.
Prerequisites
The use of Mudflap requires GCC with Mudflap support. This means that you need GCC 4.x with the "Mudflap enabled" flag, and you need to set the appropriate configuration settings (see Configuring Mudflap to find errors.) When configured properly, the IDE adds options to the Makefile variables: -fmudflapth to LD_SEARCH_FLAGS and -fmudflapth to CFLAGS1.
Why use Mudflap?
Many runtime errors in C and C++ programs are caused by pointer errors. The most common reason is that you've incorrectly initialized or calculated a pointer value and attempted to use this invalid pointer to reference some data. Since all pointer errors might not be identified and handled at runtime, you might encounter a situation where you go over by one byte (an off-by-one error), which might run over stack space or write into the memory space of another variable.
You don't always detect these types of errors because in your testing, they don't typically cause crashes or overwrite anything significant. An off-by-one error might become an off-by-one-thousand error and could result in a buffer overflow or bad pointer dereference, which may crash your program or provide a window of opportunity for code injection.
How Mudflap works in the IDE
Mudflap adds another pass to GCC's compiler sequence to instrument the binary with code that encapsulates dangerous pointer operations. Mudflap keeps a database of memory objects to evaluate any accessed pointer against a list of valid objects. At runtime, if any instrumented pointer operation is invalid or causes a failure, then a violation is emitted to the stderr stream. The violation specifies where the error occurred in the code, and what objects where involved.
You don't have to use Telnet or a serial terminal window to obtain output from Mudflap. Although it is available from the command line, you can choose to monitor the stdout stream or use the tool directly from the IDE. In fact, the IDE lets you select Mudflap as a build option.
The IDE includes a QNX launch tool that enables you to parse Mudflap errors (such as buffer overflows on the stack or heap, or bad usages of pointers), with the errors displayed similarly to those in the Memory Analysis tool. During the Mudflap launch, the IDE creates a Mudflap session, and you can then select a session item to view the errors in the source code.
#include <stdlib.h>
#include <stdio.h>

void funcLeaks(void);
char funcError(void);

int main(int argc, char *argv[]) {
   char charR;
   funcLeaks();
   charR = funcError();
   return EXIT_SUCCESS;
}
void funcLeaks() {
   float *ptrFloat = (float*)malloc(333 * sizeof(float));
   if (ptrFloat==NULL) {
     // memory could not be allocated
   }
   else {
     // do something with memory but don't forget to free and NULL the pointer
   }
}
char funcError() {
   char charA[10];
   int i;
   for(i=0; i<10; i++)
      charA[i] = 'A';
   return charA[11];
}
*******
mudflap violation 1 (check/read): time=1255022555.391940 ptr=0x8047e72 size=12
         pc=0xb8207c0b location=`C:/worksp_IDE47/z_x/z_x.c:35:2 (funcError)' thread=1
         libmudflapth.so.0(__mfu_check+0x599) [0xb8207b8d]
         libmudflapth.so.0(__mf_check+0x3e) [0xb8207c06]
         z_x_g(funcError+0x10c) [0x804922d]
         z_x_g(main+0xe) [0x80490fa]
Nearby object 1: checked region begins 0B into and ends 2B after
         mudflap object 0x80d5910: name=`C:/worksp_IDE47/z_x/z_x.c:29:7 (funcError) charA'
         bounds=[0x8047e72,0x8047e7b] size=10 area=stack check=3r/1w liveness=4
         alloc time=1255022555.391940 pc=0xb82073d7 thread=1
         number of nearby objects: 1
Leaked object 1:
         mudflap object 0x80d5290: name=`malloc region'
         bounds=[0x80d5248,0x80d525b] size=20 area=heap check=0r/0w liveness=0
         alloc time=1255022555.387941 pc=0xb82073d7 thread=1
         libmudflapth.so.0(__mf_register+0x3e) [0xb82073d2]
         libmudflapth.so.0(__real_malloc+0xb9) [0xb8208b51]
         libc.so.3(atexit+0x19) [0xb032ae29]
         libc.so.3(dlopen+0x15f3) [0xb0343fe3]
Leaked object 2:
         mudflap object 0x80d53c8: name=`malloc region'
         bounds=[0x80d5380,0x80d5393] size=20 area=heap check=0r/0w liveness=0
         alloc time=1255022555.388941 pc=0xb82073d7 thread=1
         libmudflapth.so.0(__mf_register+0x3e) [0xb82073d2]
         libmudflapth.so.0(__real_malloc+0xb9) [0xb8208b51]
         libc.so.3(atexit+0x19) [0xb032ae29]
         z_x_g(_start+0x42) [0x804902a]
Leaked object 3:
         mudflap object 0x80d5498: name=`malloc region'
         bounds=[0x80d5450,0x80d5463] size=20 area=heap check=0r/0w liveness=0
         alloc time=1255022555.389941 pc=0xb82073d7 thread=1
         libmudflapth.so.0(__mf_register+0x3e) [0xb82073d2]
         libmudflapth.so.0(__real_malloc+0xb9) [0xb8208b51]
         libc.so.3(atexit+0x19) [0xb032ae29]
         z_x_g(_start+0x61) [0x8049049]
Leaked object 4:
         mudflap object 0x80d52f8: name=`malloc region'
         bounds=[0x80dc038,0x80dc237] size=512 area=heap check=0r/0w liveness=0
         alloc time=1255022555.388941 pc=0xb82073d7 thread=1
         libmudflapth.so.0(__mf_register+0x3e) [0xb82073d2]
         libmudflapth.so.0(__real_malloc+0xb9) [0xb8208b51]
         libc.so.3(pthread_key_create+0xc9) [0xb0320549]
         libc.so.3(dlopen+0x1610) [0xb0344000]
Leaked object 5:
         mudflap object 0x80d58a8: name=`malloc region'
         bounds=[0x80e1688,0x80e1bbb] size=1332 area=heap check=0r/0w liveness=0
         alloc time=1255022555.391940 pc=0xb82073d7 thread=1
         libmudflapth.so.0(__mf_register+0x3e) [0xb82073d2]
         libmudflapth.so.0(__real_malloc+0xb9) [0xb8208b51]
         z_x_g(funcLeaks+0xd) [0x8049117]
         z_x_g(main+0x9) [0x80490f5]
         number of leaked objects: 5

Process 81942 (z_x_g) exited status=0.
The IDE will populate the Mudflap Violations view with the contents of the Mudflap log file specified in the launch configuration. This provides you with additional information about the violation(s) that Mudflap detected.
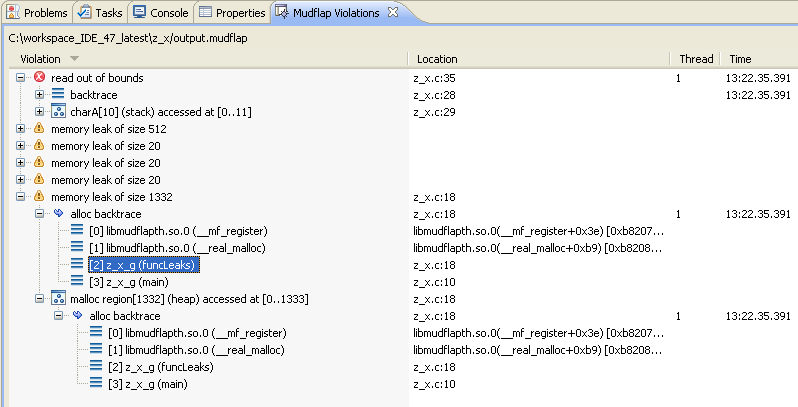
The top level of the main view shows the errors, and if you expand a particular violation, you receive information about nearby objects, a backtrace, similar errors, and other useful information.
For more information about the Mudflap results, see Mudflap Violations view.