After enabling code coverage for your project and building it with coverage instrumentation, you must create a launch configuration that contains the Code Coverage tool. Then you can run the program defined by the project and collect coverage data.
To start a program and measure its code coverage:
-
Select the Code Coverage tab, and fill in any required fields.
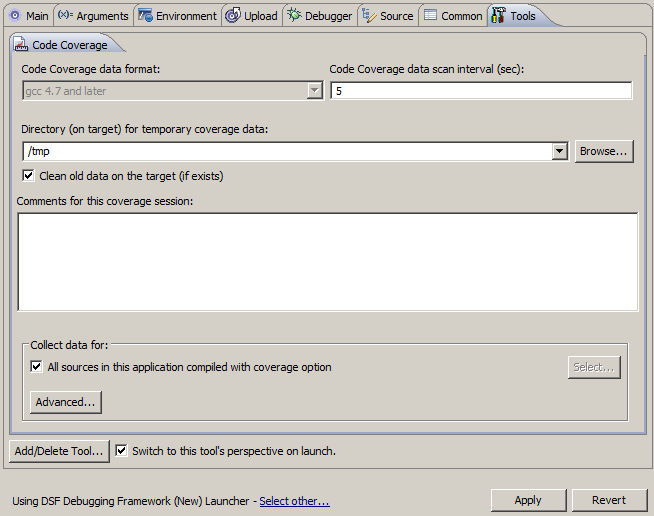
- Code Coverage data format
- This field is permanently set by the IDE to gcc 4.7 or later, meaning it can collect code coverage metrics only from programs compiled with gcc 4.7 or later.
- Code Coverage data scan interval (sec)
- How often the Code Coverage tool polls for data, in seconds. A low setting can cause continuous network traffic. The default setting of 5 seconds should be sufficient.
- Directory (on target) for temporary coverage data
- Target location for writing the code coverage data files. By default, this field names the directory that the executable binary is uploaded to (e.g., /tmp). You can click Browse to open a file selector and manually select a target filesystem directory.
- Comments for this Code Coverage session
- Your own notes about the session. The comments appear at the top of generated reports.
- Collect data for
- By default, the new session includes all coverage data from only the project
being launched. To include data from referenced projects or only certain files,
disable the option
All Sources in this application compiled with code coverage,
then click Select to open a dialog that lets you
select the projects or files for which you want to see data:
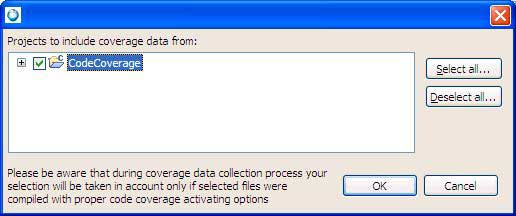
For projects, they must be built with code coverage to collect any data.
- Advanced
- Click Advanced to define a signal to enable the
dynamic collection of code coverage data. To perform data collection, the
IDE will send this signal to the program.
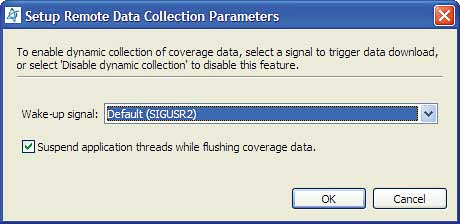
- You also have the option to suspend the program threads while flushing the data. When you're finished configuring the data collection parameters, click OK to return to the launch configuration.
The program starts running on the target and code coverage data is collected by the IDE.
Information about viewing the data in the QNX Code Coverage perspective and the supported operations (e.g., saving the data to
a report) is given in the sections that follow.