This view works with the Timeline pane to provide developers with a single-click answer to the question: "Why is this thread running?" In this context, "this thread" refers to the owner of the currently selected event.
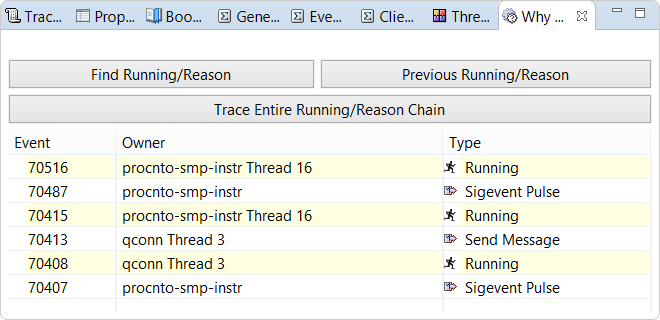
- The Running event for the current thread
- The event that made the previously running thread change state, allowing the current thread to run
To learn why the previously running thread could run earlier, click Previous Running/Reason to see the two events related to that thread's transition to the Running state. You can repeat this action to get a clear view of the sequence of activities that led to the original execution position. Or, you can click Trace Entire Running/Reason Chain (either just after you clicked an event tick mark or any time when you see the partial execution sequence) to display the entire backtrace of Running events.
If you click a tick mark for a procnto idle thread or the Previous Running/Reason button when the entire backtrace is already displayed, you'll get a message saying the end of the chain was detected, and no new events will be listed.