You might want to know which processes consume the most CPU cycles at certain points in time as your embedded system runs. The System Profiler provides several tools to extract this information.
Requirements
To extract CPU usage metrics using the System Profiler tools, the captured log file must contain at a minimum the QNX Neutrino RUNNING thread state. If the RUNNING thread state is logged in wide mode, then additional information regarding CPU usage distribution over priority and partitions can also be calculated.
To determine the CPU load caused by interrupts, you must also log the Interrupt Entry/Exit events.
Procedure
To start, open the log file in the QNX System Profiler perspective. By default, the editor
area should show the Summary pane; if it doesn't, you can switch to this pane
through the menu item , or by selecting this pane in the editor's dropdown menu for switching panes
(![]() ).
).
The Summary editor pane shows an overview of the data captured in the log file:
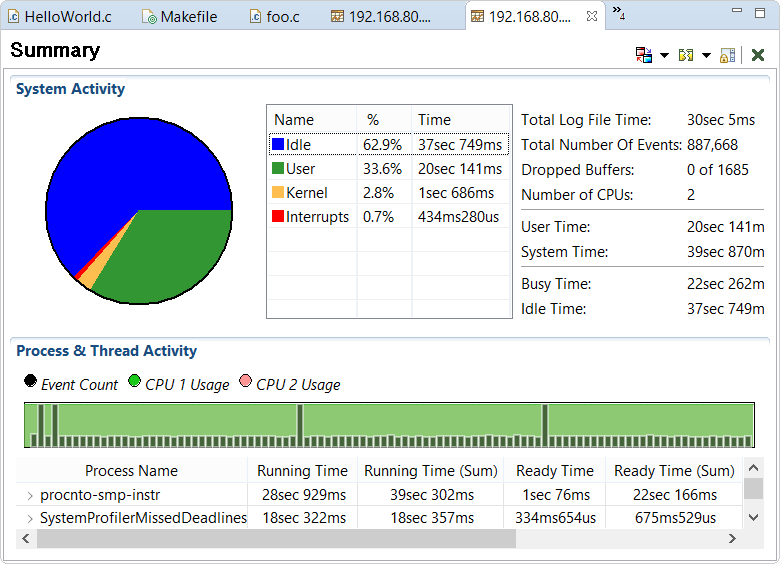
- Idle
- The amount of time, over the period captured in the log file, that the idle thread spent running.
- Interrupts
- The amount of time that the CPU spent servicing hardware interrupts.
- Kernel
- The amount of time that the CPU spent in kernel calls, which doesn't include time spent servicing hardware interrupts.
- User
- The amount of time that non-idle threads spent in the QNX Neutrino RUNNING state, minus the time spent in kernel calls or interrupt handlers.
Using these metrics, you can get a rough estimate of how efficiently your system is performing (e.g., amount of idle time, ratio of system to user time, possible interrupt flooding).
The distribution of CPU usage over the time of the entire log file is shown graphically in
the Process & Thread Activity section overlaid with the volume of events that have been
generated. This same data is also available in the Overview view accessed via .
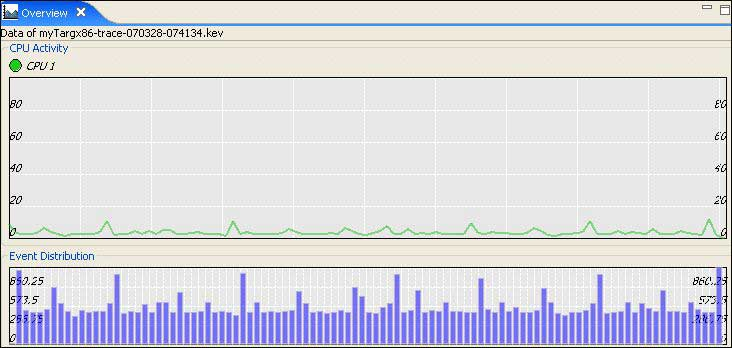
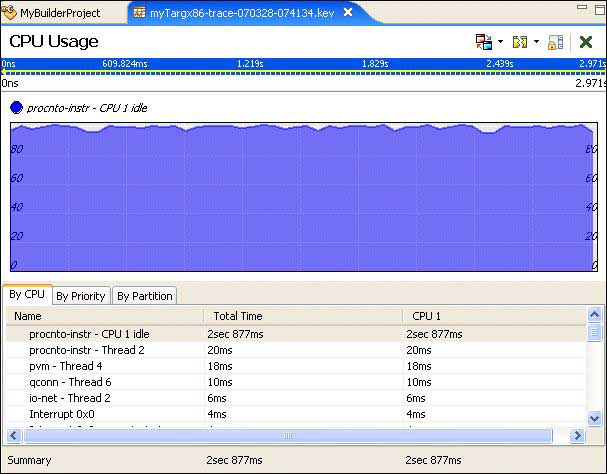
The peaks of these results indicate areas of particularly high CPU usage and hence, are the areas of most interest. To focus on the particular threads that are causing these peaks, switch the editor display pane to the CPU Usage pane. You can do this via the menu item , or by using the editor dropdown menu.
The CPU Usage pane displays a chart of the CPU usage of threads and interrupts over time,
and provides a tabular view showing the sum of this usage categorized by CPU, priority, or
partition:
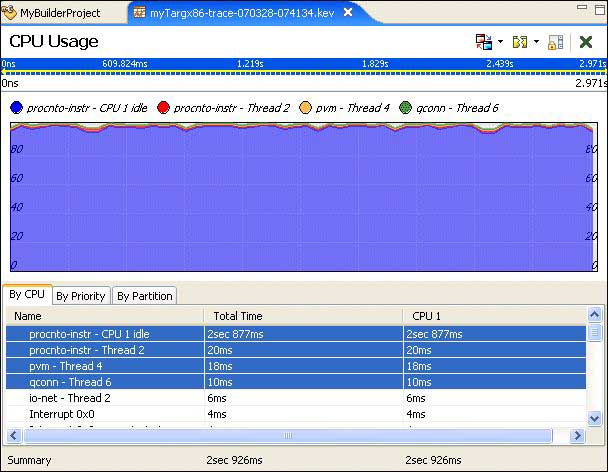
By selecting multiple elements in the table, you can stack the CPU usage to see how threads
and interrupts are interacting. For example, selecting the first few non-idle CPU consumers in
this example provides the following result:
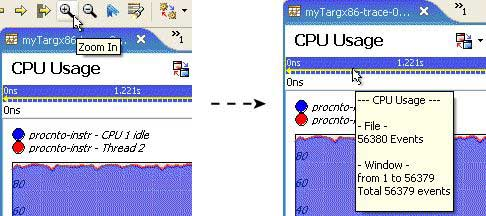
By selecting a region of the display, you can zoom in to an area of interest to examine
the CPU usage in greater detail. As you zoom in, the editor panel's time bar is updated
updated to show the new range:
This example has shown the CPU usage for process threads, but this technique applies equally well to individual interrupt handlers, which appear as CPU consumers in the same manner as threads.
The CPU Usage pane lets you quickly and easily isolate and assign CPU consumption behavior to specific threads. With this information, you can then use a more specialized and application-centric tool, such as the Application Profiler, to look more closely at execution behavior in relation to the application source code.