- heap memory corruption
- attempts to free non-heap pointers
- writing to previously freed memory
- memory leaks
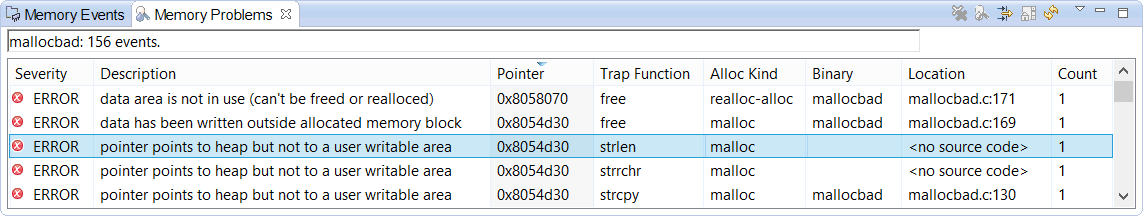
To see data in the Memory Problems view, you must click a session (or a component such as a file or thread)
in the Sessions View. The following image shows some typical problems that you might see:
If you want to capture the memory error data and review it outside of the IDE, press Ctrl–A to select all of the information in the table, then Ctrl–C to copy it as text to the clipboard.
| Type | Description |
|---|---|
| Expand | When errors are grouped, clicking the arrow in this leftmost column toggles between displaying a summary row or all errors in the group. |
| Severity | LEAK or ERROR with corresponding icon. |
| Description | An error message. |
| Pointer | The address stored in the pointer involved in the error or leak. |
| Trap Function | A function that was checked when the error was detected. |
| Time Stamp | The library timestamp (can be wrapped data). |
| PID | The process ID. |
| Alloc Kind | The type of heap operation involved in the error. |
| TID | The thread ID. |
| State | The state of the pointer, either "in use" or "freed". |
| Event ID | A unique event ID, ordered by error occurrence. |
| Binary | The binary for the top frame of a backtrace. |
| Location | The source location (file:line) for the top frame of a backtrace. |
| Count | When errors are grouped, this field represents a count of the errors. |
- Show full file path — Show the full file path in the Location column. The default is to show only the base name.
- Max rows — Limit the maximum amount of rows displayed. For performance purposes, a limit of 1000 is recommended; however, if you have more rows, you can use grouping or filtering to reduce the number.
For descriptions about the information displayed for particular errors, see Summary of Memory Analysis errors. For information about the general error categories, why the errors occur, and how to fix them, see Interpreting Memory Analysis results.
- Double-clicking a particular problem entry makes the IDE highlight the corresponding source code line (if it exists) in the editor.
- Clicking an entry makes the IDE update the backtrace in the Memory Backtrace view.
- Clicking a column header sorts the data by that column value.
- Dragging and dropping columns by their header rearranges the column order.
- Pressing Ctrl–C makes the IDE copy the text representation of the selected problems to the clipboard.
- Double-clicking the view header maximizes the view (or returns it to normal when it's maximized).
View toolbar
- Remove Events — remove (by filtering) the current events from the view. This is enabled when the program is running.
- Dump Leaks — execute the dump leaks command (the application must be running the control thread). This is enabled when the program is running.
- Open Filter Dialog — open the Filter dialog (see the description in Memory Problems filter).
- Prevent Auto-Refresh — don't perform a refresh automatically. This is enabled when the program is running.
- Refresh — force a refresh.
There are also the standard buttons for accessing the view menu and minimizing and maximizing the view. The view menu has the same Filter, Group By, and Preferences options as the context menu, for which all of the options are described below.
Context menu
- Filter… — opens the traces filter (see the description in Memory Problems filter, below).
-
Quick Filter
- Up to Event — show all errors up to this current error (by time occurrence).
- From Event — show only the errors from this current error (by time occurrence).
- Same backtrace — show only errors with the same backtrace.
- Show All — reset the filter.
- Copy — copy the data from the selected events to the clipboard.
-
Group By
- None — no grouping is done.
- Type — group by error type.
- Backtrace — group errors with the same backtrace under a single group. For group entries, the non-aggregated column shows a value for the first entry.
- Thread — group by thread ID.
- Severity — group by error severity.
- Show Backtrace — activates the Memory Backtrace view and shows the current backtrace in it.
- Show Source — navigate to the selected event's source location in the editor.
- Preferences… — open the view preferences dialog to set the column selection and order.