Double-clicking on a session's name opens the Memory Analysis editor for that session.
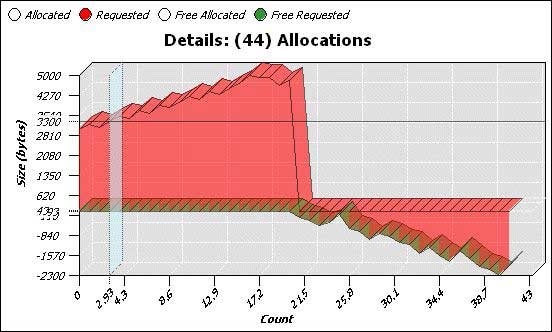
The top part of the editor (or Details pane) shows details for the data selected in the bottom part
(or Overview pane), which shows an overview of the entire session data set:

Note: If the process does many allocations and deallocations, it could take some time for the traces and events to be registered,
indexed, and shown.
The tabs at the bottom let you switch between several tabs that display different data:
- Allocations tab — trace information about allocations and deallocations
- Bins tab — counters that track the general size of allocations and deallocations
- Bands tab — counters that track the allocator's use of preallocated memory bands
- Usage tab — information about the application's memory usage over time
- Settings tab — settings for the running process
Selecting data
To select data in the Overview pane, click and drag over the chart region you're interested in. The Memory Analysis editor updates the Details pane to reflect the data region you've selected.
Controlling the page layout
The Memory Analysis editor has several icons that you can use to control the view:
| Use this icon: | To: |
|---|---|
|
|
Set the Overview and Details panes to a horizontal layout, one beside the other |
|
|
Set the Overview and Details panes to a vertical layout, one above the other |
|
|
Show the Details pane if it's currently hidden |
|
|
Hide the Details pane so the Overview pane has more display room |
|
|
Hide the Overview pane so the Details pane has more display room |
|
|
Toggle the Overview pane on and off |
Controlling the overview
Right-click on the Overview pane (the bottom chart) to change the view options.
The context menu includes these options:
- By Timestamp
- Sort the events by timestamp. Because several memory events can have the same timestamp, these events might appear in a confusing order (e.g., a buffer's allocation and deallocation events could be shown in the wrong order if they happen during the same sampling interval).
- By Count
- Sort the events by their index. This is the default ordering in the Overview pane.
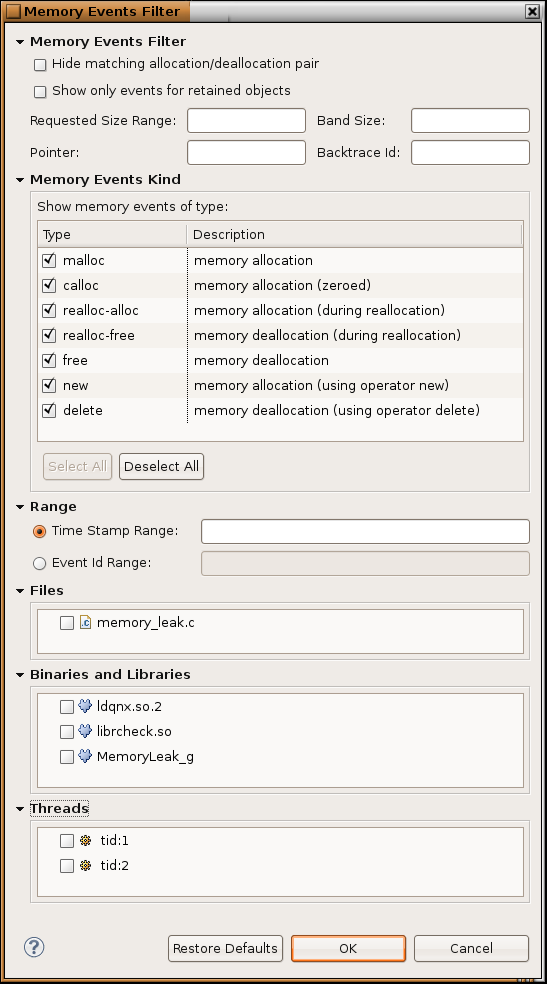
- Filters...
- Filter the events shown by size, type, or both. You can also hide matching allocations and
deallocations so that you see only the unmatched ones:
- Zoom In
- Zoom in on the selected range of events.
- Zoom Out
- Zoom out to the set of memory events that you previously zoomed in on.
Controlling the Detail pane
To control the Detail pane through its context menu:
- Right-click on this pane and choose a graph from the Chart Types menu:
BarChart — a plain bar chart 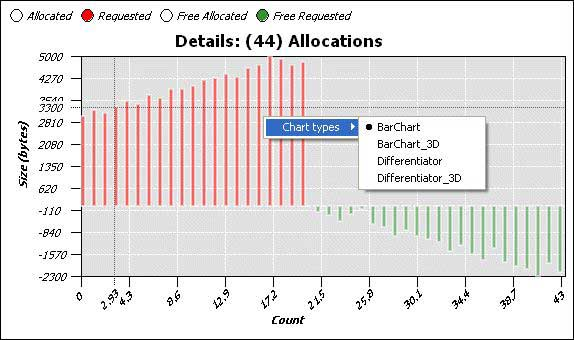
BarChart_3D — a 3D bar chart 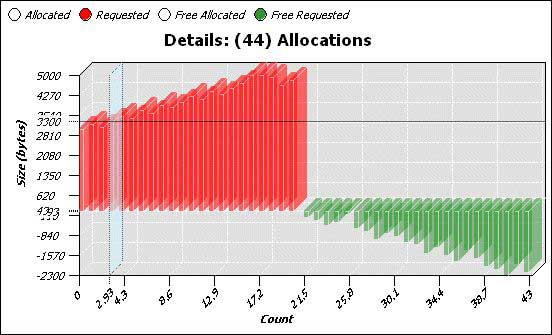
Differentiator — a plain differentiator chart 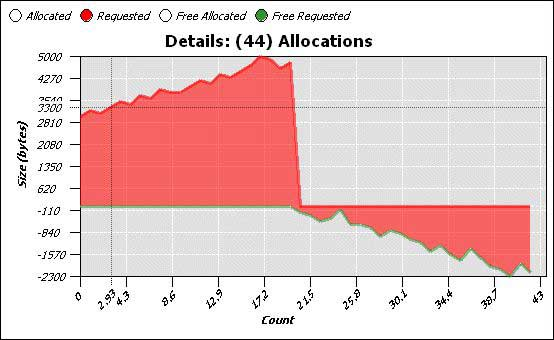
Differentiator_3D — a 3D differentiator chart