- In the Images directory in the System Builder Projects view, right-click the .elf file and select Debug As > Debug Configurations…
- Create a new instance of the GDB Hardware Debugging debug configuration.
-
On the Main tab, specify the name of your project and select
the appropriate .elf or .srec file as the C/C++ Application.
You want to select the image file that will be uploaded to the target board's RAM through the JTAG pins.
-
Click the Debugger tab.
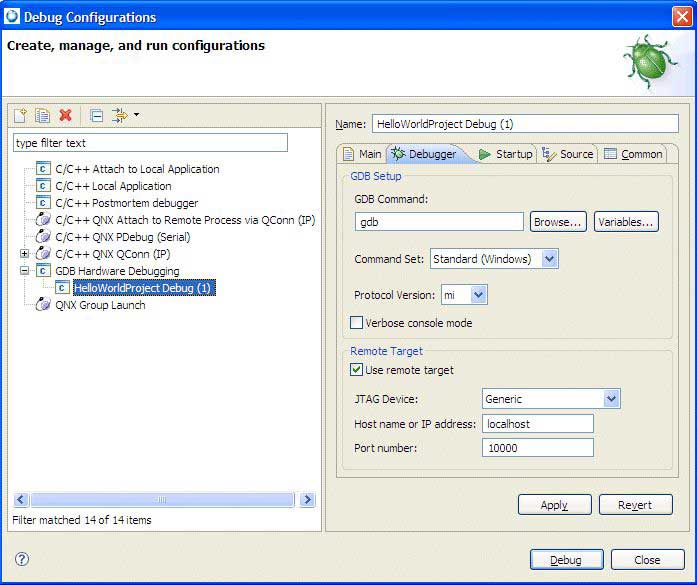
- Change the GDB Command field to the path of a gdb debugger appropriate for your target architecture (e.g., ntoppc-gdb.exe).
- In the Remote Target area, select the Use remote target checkbox and ensure that the JTAG Device combo box is set to Macraigor Usb2Demon.
-
Verify that the Host name or IP address field is set to the
IP address assigned to the Macraigor device.
It's usually localhost if you run OCDRemote on the same machine from where you launch the debugging. The port number, unless you have manually changed it, is 8888.
-
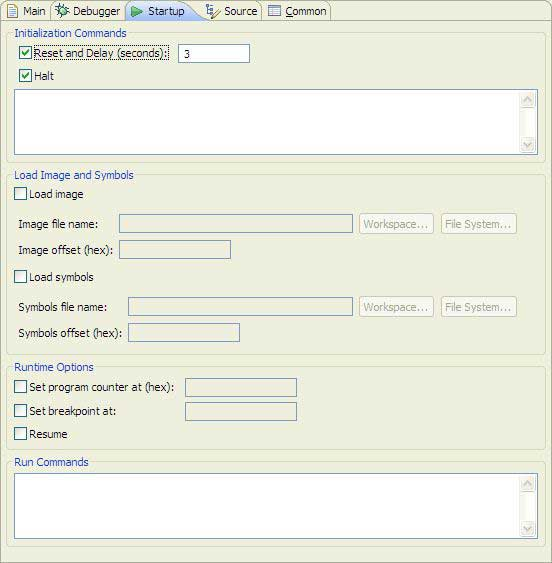
Click the Startup tab.
-
Select the Reset and Delay (seconds) checkbox, and enter
the number of seconds to wait between resetting the target board and halting it to
send the image.
You should allow enough time to bring up all hardware.
Since just about every board loaded with a U-Boot, IPL, or ROM Monitor needs to wait a few seconds for the prompt before halting the processor to send the image, a delay of 3 seconds is sufficient for waiting between resetting the board and starting to load the image.
- Check the Halt checkbox to stop the target in order to start sending the image.
-
If there are any monitor commands you would like to execute before sending
the image to the target, type those commands in the Halt field.
Individual commands should be separated by newlines and prefixed with the keyword monitor and a space. You don't need to add commands to restart or halt the board, as this is done automatically.
-
Check the Load image checkbox and specify the image file.
You can type the filename into the top text field or click one of the buttons next to it to open a file selector and then navigate to and select the image file. You want to select the .elf or .srec file that will be uploaded to the target board's RAM through the JTAG pins.
- In the Image offset (hex) text field, type the number previously noted in the Properties view, in Step 11 in "Building a system image".
-
Check the Load symbols checkbox and in the top text field,
specify the symbol file.
You can specify the symbol file in the same ways as you can specify the image file.
The symbol file provides information for source-level debugging. For most BSPs, the symbol file has the same name as the image file, except for the extension (.sym). Note that the IDE issues a warning message if you build the image without debug symbols. Leaving this textbox blank results in no debug symbols being loaded, allowing for assembly-level debugging only.
- In the Symbols offset (hex) field, type the value in the first column of the console output line containing .sym, in Step 13 in "Building a system image".
- Check the Set program counter at (hex) checkbox and type the value in the third column of the console output noted earlier.
- Check the Set breakpoint at checkbox and type the name of the function you want to set as the initial break point, for example _main.
- Check the Resume checkbox.
- In the Run Commands field, type any GDB commands that you would like to have automatically executed after the image and symbols have been successfully uploaded to the target. For example, you can type the si command at the end of this box to start stepping.
- Click Apply.
- Click Debug and begin debugging.