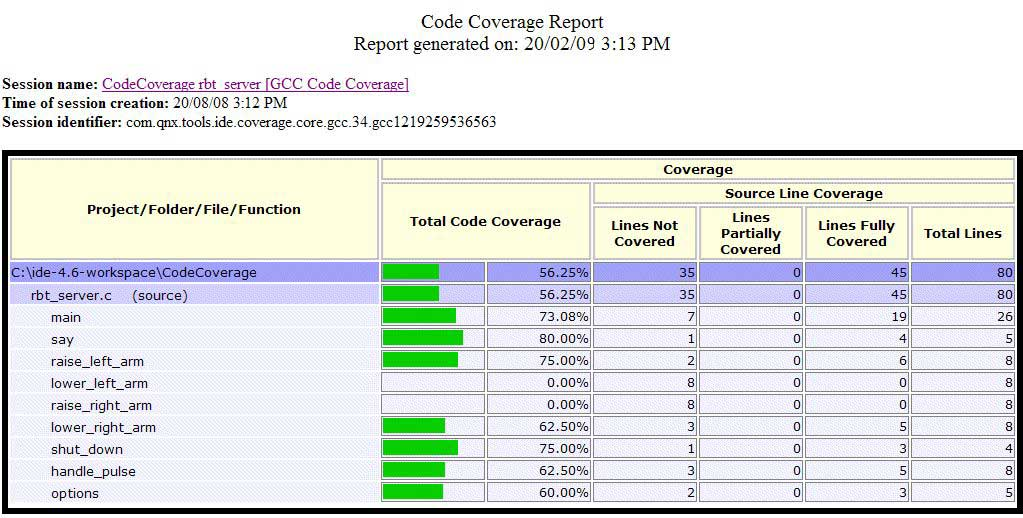
The IDE lets you generate a code coverage report so you can visualize the data for a session.

You can change the web browser used for displaying reports by accessing the web browser preferences through , selecting Use external web browser, then clicking the browser you want to use in the list of browsers.
You can also choose to view the reports within the IDE, by selecting
Use internal web browser in the same preferences dialog. With this selection, the report is shown
in a special view, Coverage Report. The advantage to this setup is that you can click the view's refresh icon
(![]() ) to update the report, which is handy for active sessions.
) to update the report, which is handy for active sessions.