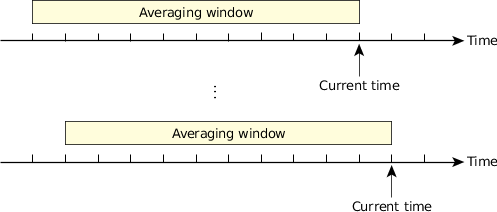
The adaptive partitioning thread scheduler throttles CPU usage by measuring the average CPU usage of each partition. The average is computed over an averaging window (typically 100 milliseconds), a value that is configurable.
However, the thread scheduler doesn't wait 100 milliseconds to compute the average. In fact, it calculates it very often. As soon as 1 millisecond passes, the usage for this 1 millisecond is added to the usage of the previous 99 milliseconds to compute the total CPU usage over the averaging window (i.e. 100 milliseconds).

The window size defines the averaging time over which the thread scheduler attempts to balance the partitions to their guaranteed CPU limits. You can set the averaging window size to any value from 8 milliseconds to 400 milliseconds.
Different choices of the window size affect both the accuracy of load balancing and, in extreme cases, the maximum delays seen by ready-to-run threads. For more information, see the Considerations for the Thread Scheduler chapter.
Because the averaging window slides, it can be difficult for you to keep statistics over a longer period, so the scheduler keeps track of two other windows:
- Window 2 — typically 10 times the window size.
- Window 3 — typically 100 times the window size.
To view the statistics for these additional windows, use the show -v or show -vv option with the aps command.
The thread scheduler accounts for time spent to the actual fraction of clock ticks used, and accounts for the time spent in interrupt threads and in the kernel on behalf of user threads. We refer to this as microbilling.