In addition to asking why a particular process's thread may be running, developers are often faced with the task of understanding what the rest of the system is doing at a particular point in time. This question can easily be answered using the Thread State Snapshot view ().
Thread State Snapshot view, is keyed off of the current cursor position in the System Profiler editor Timeline pane. For a given time/position, it determines the state of all of the threads in the system.
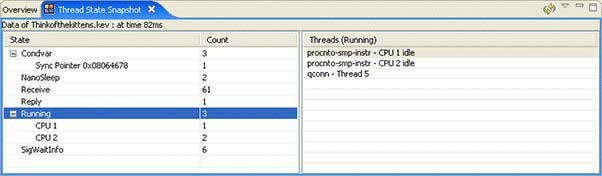
The System Profiler's Thread State Snapshot view.
Note that when you select a point in the Timeline, you must click the Refresh icon in the Thread State Snapshot view's toolbar to update the contents of the Thread State Snapshot view .