You can run a process on the target (without the IDE) and collect the profiling information while it's running. In order to collect profiling information, you have to modify the way you normally launch your application by adding environment variables:
Note: If you're launching using the IDE, you can specify the environment variables on
the Environment tab in the launch configuration.
- For Sampling only — no modification is required.
- For Sampling and Call Count — the application has to be instrumented
with Call Count, and the environment variable QCONN_PROFILER
has to be set to /dev/profiler. For example:
QCONN_PROFILER=/dev/profiler ./appname
- For a Call Count instrumented binary, the following environment variables affect
application behavior at runtime:
- PROFDIR=dir — turn on data collection. Data is stored in a file dir/processId.binaryName. For example if you run PROFDIR=/tmp ./myapp, the data would be available in the file named /tmp/12345.myapp. Use this option for postmortem profiling.
- QCONN_PROFILER=/dev/profiler — setting this variable to a fixed value causes data collection to be turn on, and data is then sent to the /dev/profiler resource manager, which sends it to the IDE. Use this option when attaching to a process from the IDE.
- For a Function Instrumented binary, the following environment variables affect
application behavior:
- QPROF_AUTO_START=0 — don't start profiling automatically; instead, wait for a signal. The default is 1 (start).
- QPROF_FILE=file — enable the profiler data capture process and store output to the file/device. By default, profiling is turned off. The QPROF_FILE variable should be set to /tmp/app.ptrace (the path to the file or target; the same value must be used later when attaching).
- QPROF_KERNEL_TRACE=1 — use kernel trace events instead of the profiler trace.
- QPROF_SIG_STOP_PROFILING=signum — install the stop profiling handler for the signum signal. By default, it isn't installed. The recommended value is 15.
- QPROF_SIG_CONT_PROFILING=signum — install the resume profiling handler for the signum handler. By default, it isn't installed. The recommended value is 16.
- QPROF_HELP=1 — prints profiler help and exits the application.
Note: When you profile a running process, you can't use the Console view in the IDE to
interact with this process. If your running process requires user input through the
Console view, use a shell to interact with the process.
To profile a process that's already running on your target:
- While the application is running, open the Launch Configurations dialog by choosing from the menu.
- Select C/C++ QNX Attach to Remote Process via QConn (IP) from the list on the left.
- Click the New button to create a new attach-to-process configuration.
- Configure things as you normally would for launching the application with debugging.
- On the Tools tab, click Add/Delete Tool…. The Tools Selection dialog is displayed.
-
Select the Application Profiler tool, then click
OK. On the launcher, the Application
Profiler tab is displayed.
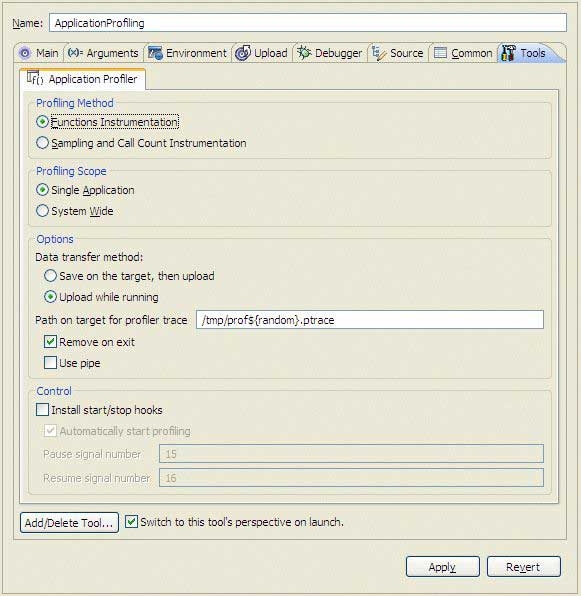
For descriptions about the options, see Application Profiler tab.
- If you're using Function Instrumentation, make sure that the value in the Path on target for profiler trace field matches the value of QPROF_FILE that you used to run the application.
- Select Switch to this tool's perspective on launch.
- Optional: In the launcher, click the Shared Libraries tab. The IDE doesn't know the location of your shared library paths, so you must specify the directory containing any libraries that you wish to profile.
-
Click Apply, and then click Run.
The Select Process dialog shows all of the currently running processes:
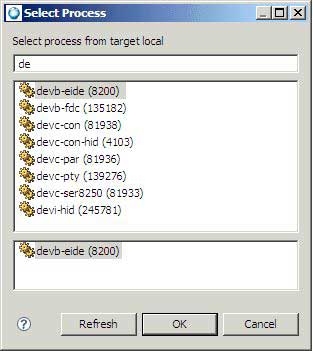
- Select the process you want to profile, and then click OK.