The Why Running? view () works in conjunction with the System Profiler timeline editor pane to provide developers with a single click to answer the question Why is this thread running? where this thread is the actively executing thread at the current cursor position.
By repeating this action (or generating the entire running backtrace) developers can get a clearer view of the sequence of activities leading up to their original execution position. Not to be confused with an execution backtrace, this running backtrace highlights the cause/effect relationship leading up to the initial execution position.
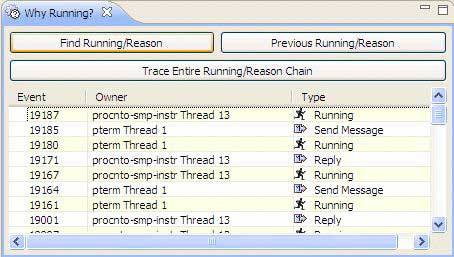
The System Profiler's Why Running? view.