Trace event log files contain a wealth of information, but unfortunately that information is often buried deep in among thousands, if not millions, of other events. The System Profiler tooling helps provide tools to reduce and remove some of this noise to help you focus on the areas of a log that are important to you.
Requirements
There are no specific requirements for this use case, but some of the topics may not apply, depending on the types of events that have been captured.
Procedure
We'll walk through some of the tools available to help you to reduce and filter the data contained in a trace event file. Where this information is most useful is during investigations involving the Timeline editor pane. The timeline displays information with a very fine granularity and is often the display that users turn to in order to single step through the execution flow of an activity of interest. To open the Timeline editor pane, select .
Timeline editor pane filters
The first level of data reduction is to use the Filters view to remove information that isn't significant for the tracing of the problem you're interested in. By using filters in conjunction with zooming and searching capabilities, you can quickly reduce the overall data set.
The Filters view is synchronized with the active System Profiler editor; you can display it via the menu or by right-clicking Filters… in the Timeline editor pane.
This view provides you with the following types of filtering:
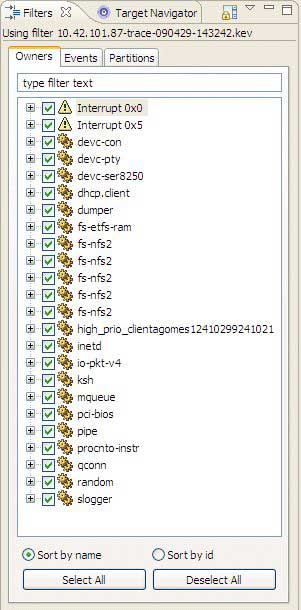
- The Owners tab shows a list of event owners/sources, letting you select or unselect event owners to be displayed. Unselecting an event owner in the list removes that owner from the Timeline editor pane.
- The Events tab is similar to the Owners tab, but it provides filtering capabilities for individual trace events rather than for the owners of those events.
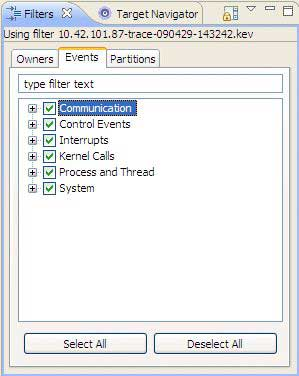
For information about types of events, see Classes and events in the chapter Events and the Kernel in the System Analysis Toolkit.
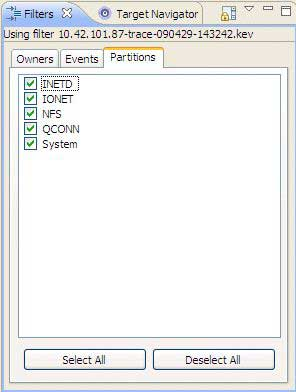
- The Partitions tab provides filtering capabilities that only show data related to the partitions that you specify.
Select the context menu in the Filters view to access additional filter options. Select Configure Filters… from the Filters view menu to configure the filters for System Profiler.
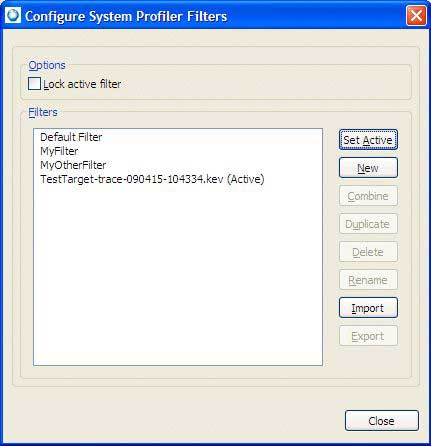
Configuring filters for System Profiler.
The Configure System Profiler Filters dialog provides a listing of preconfigured filters that are available for use. These filters are often based on more sophisticated criteria for determining if events, event owners, or partitions are to be displayed.
Trace event log filter synchronization
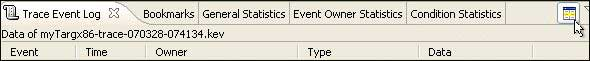
By default, the Trace Event Log view presents a display that uses the same filters as the currently active editor. However, there are times when it's useful to be able to temporarily unfilter the Trace Event Log view display to see the raw content of the log file. You can accomplish this by toggling the editor's Synchronize button on the Trace Event Log view display:
Timeline find
There are times when you're looking at an event stream and want to quickly navigate through it. One mechanism for doing this is to move to the next or previous event, using the toolbar commands (Next, Previous, Next Event In Selection, Previous Event In Selection).
Another, more flexible, alternative is to use the Find functionality of the Timeline editor pane. Selecting opens a dialog similar to the one found in many text editors:
The dialog supports searching a restricted set of event owners (based on the selection made in the Timeline editor pane) as well as searching forwards and backwards through the log file. This is convenient when you know specifically what type of event you're looking for in a sequence of events (e.g. the next RUNNING state for a thread).
The Find dialog moves the selection marker in the Timeline editor pane to the appropriate event.
Trace Search
If you need to generate a collection of events matching a particular condition, or you need to construct a more complicated expression (perhaps including event data) in order to find the events you're looking for, you need the power of trace event conditions and the Trace Search tool.
The Trace Search tool is invoked via the menu item . Opening this up presents a dialog similar to the following:
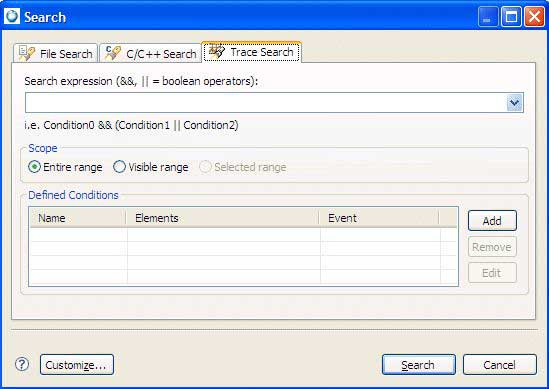
Searching is based on trace conditions. Trace conditions describe a selection criterion for matching an event and can be based on anything that an event provides (ownership, data payload, and so on).
To add a condition that will locate all of the MsgSend() calls that may have been made for write system calls:
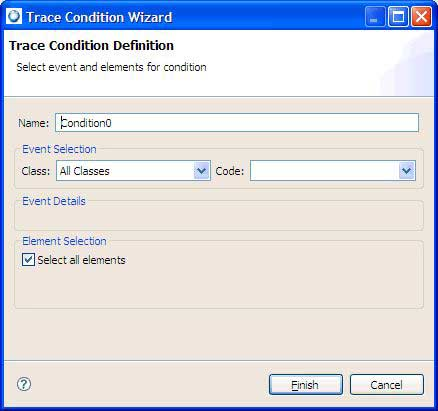
- Add a new condition via the Add button in the search dialog. This brings up a new condition dialog that you can fill in with the MsgSendv() kernel call and the write() function entry to match. When matching string values (such as function names), the matching is done based on a regular-expression match.
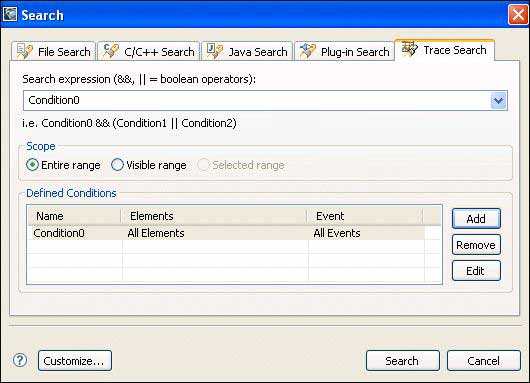
- Once you've defined the condition, it shows up in the Defined Conditions table shown in the Trace Search panel. You can combine individual conditions to form Boolean expressions if required.
- Specifying the newly created condition in the Search Expression drop-down and selecting Search automatically opens up the Search Results view. If the Timeline editor pane is open, double-clicking on a search result (assuming that the result isn't filtered) moves the timeline selection directly to that event:
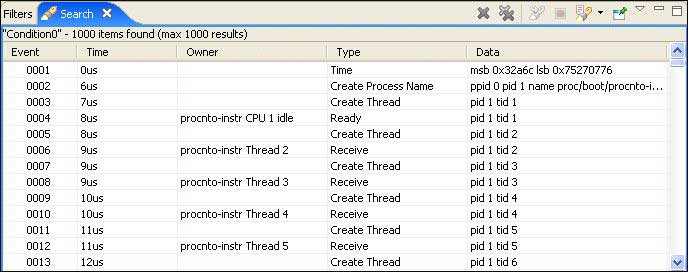
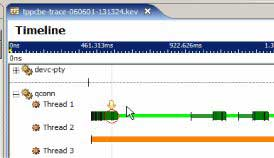
Search results are also marked in the timeline to help show the event distribution over the period of the log file:
Exporting filtered log files with Save As
Often the kernel event files that are captured are large and contain a significant amount of nonessential data for the problem at hand. Of course, this is generally only determined after the fact, once you've performed some basic analysis.
You can use the menu command to create a new log file that's based on the current log file in the System Profiler editor.
You can restrict the new log file to just the selected area (if you've made a selection), and you can also use the current filter settings (event and event owner) to reduce the amount of additional data that's stored in the log file.
The new log file contains the same attribute information as the original log file (including the system version, system boot time, number of CPUs, and so on). Any event owners, such as interrupts, processes, and threads, which are referenced by events in the new log file, are synthetically created with timestamps matching the start time(s) of the new log file.