This view provides a tabular statistical representation of particular events. The statistics can be gathered for the entire log file or for a selected range.
When you first open the Condition Statistics view, it contains no data:
![]()
You must configure conditions and the table to view condition statistics.
Configuring conditions
To configure conditions for the Condition Statistics view:
- Click the Configure Conditions… button, or select
Configure Conditions… from the view's dropdown
menu (
 ). The IDE displays the Modify Conditions dialog.
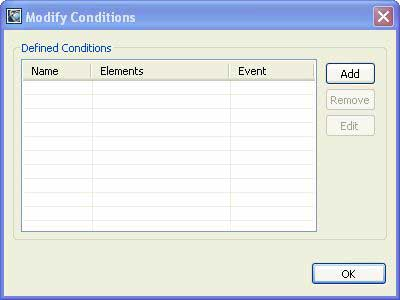
- Click Add to open the Trace Condition Wizard.
The IDE displays the Trace Condition Wizard dialog:
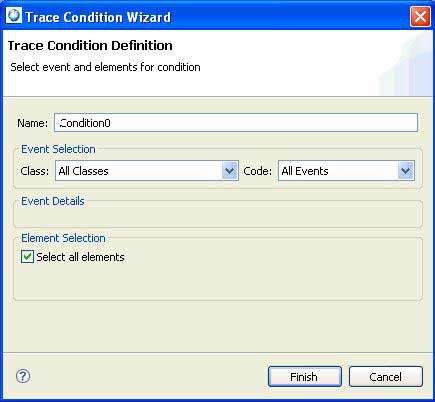
- Give your condition a unique name and select the appropriate class and code. For example, select Process and Thread from the Class dropdown menu, then select Mutex under the Code dropdown menu.
- Click Finish.
- Click OK in the Modify Conditions dialog.
- Click the Configure Table Condition Contents
(
) button, or choose Configure Table... from the view's dropdown menu.
The IDE displays the Condition Selection dialog:
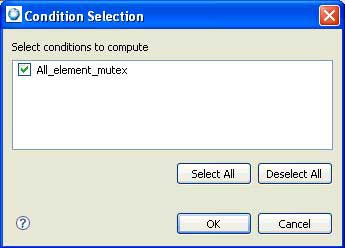
- Add a check mark beside the conditions that you want to list in the table.
- Press OK to confirm your selections.
Note: You'll need to click the Refresh button
( )
to populate this view with data.
)
to populate this view with data.