Sampling mode provides you with profiling information for your project at a specific time interval (the Application Profiler takes samples from processes at given rate). The information is recorded into a sample that you can use for comparison purposes.
When you use sampling mode to obtain only data, you'll notice the following:
- To use basic sampling, you're not required to recompile your application.
- This mode won't provide you with you precise function times, but you can use the data for comparison purposes.
- The profile will run and gather sample data for a long period of time.
Launching from the IDE
To prepare your binary for Call Count instrumentation:
- Optional: Depending on your type of project, do one of the following to prepare your binary:
- For a QNX C/C++ project:
- In the Project Explorer view, right-click your project and select Properties.
- In the left pane, select QNX C/C++ project.
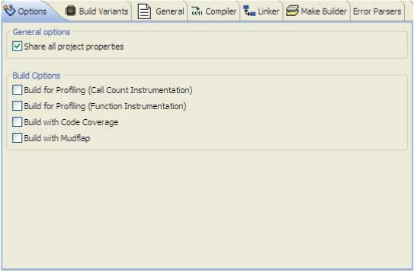
- In the right pane, select the Options tab.
- Select Build for Profiling (Call Count Instrumentation).
- For a managed project:
- Right-click on a project and select Properties.
- From the menu, select .
- From the list on the right for your compiler (i.e. QCC Compiler), select an item from the list and select Output Control.
- Select the Enable call count profiling (-p) option.
- From the list on the right for your linker (i.e. QCC Linker), select an item from the list, then select Output Control.
- Select the Build for Profiling (Call Count) (-p) option.
- For a Makefile:
To build a C/C++ project for profiling, compile and link using the -p option. For example, your Makefile might have a line like this:
CFLAGS=-p CXXFLAGS=-p LDFLAGS=-p
- For a QNX C/C++ project:
- Create a launch configuration for your application, add click the Tools tab.
- Select Application Profiler and click OK.
- From the Application Profiler tab, select Sampling and Call Count Instrumentation.
- Select the Single Application option.
- Select the Switch to this tool's perspective on launch checkbox.
- Run the configuration to begin the profiling process.
Now, your application is launched, as well as the Application Profiler tool. The Application Profiler perspective opens and the Execution Time view shows data from the current session; the view is automatically refreshed.
To customize your Execution Time view if you're running in this mode:
- In the Execution Time view, select from the menu.
- Deselect the following columns because they aren't applicable:
- Deep Time
- Average
- Max
- Min
- Deselect the option Show percent in the Name column.
- Deselect the option Show own time as a node.
- Click OK.
- Click the Show Table button. This is the recommended mode to start the Sampling and Call Count mode.
- Click the Shallow Time column to sort by time.