The annotated source editor lets you see the amount of time your program spends on each line of code and in each function.
To open the editor:
- Launch a profile session for a debuggable (i.e. _g) executable.
- In the Profiler Sessions view, select your program by selecting an Application
Profiler instance (
 ) or an executable (
 ).
). - In the Execution Time view, double-click a function that you have the source for.
The IDE opens the corresponding source file in the annotated source editor:
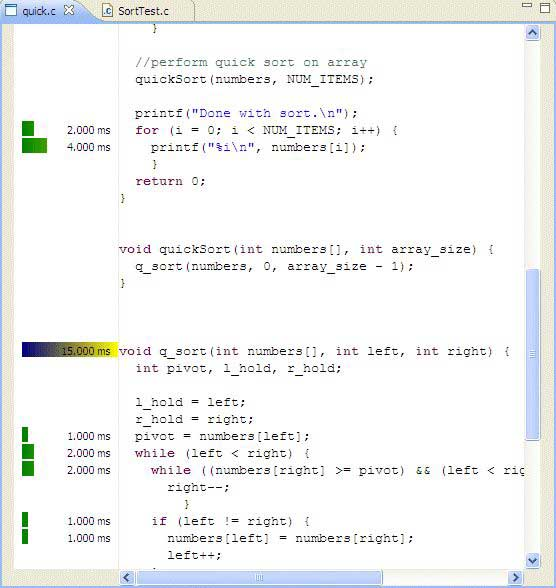
The annotated source editor shows a solid or graduated color bar graph on the left side, as well as providing a Tooltip with information about the total number of milliseconds for the function, the total percentage of time in this function, and for children, the percentage of time in the function as it relates to the parent.
The length of the bar represents the percentage. On the first line of the function declaration, that bar provides the total for all time spent in the function. The totals include:
- The amount of time for the inline sampling or call-pair data.
- CPU time spent on a line of code as a percentage of the program's total CPU time. Within a function, the lengths of the yellow bars add up to the length of the green bar.
- The total function time, usually on the first line of the function declaration.
The colors on the bars represent:
- Green-Yellow
- The amount of time for the inline sampling or call-pair data.
- Blue-Yellow
- The time it took to execute the function and all of its descendants. For the function, it includes the period from the time function starts until it ends, which includes the shallow time of this function, the sum of the children's deep times, and all time in which the thread isn't running while blocked in this function.
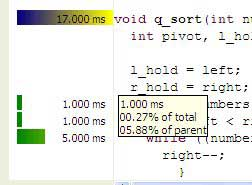
To view quantitative profiling values:
- In the annotated source editor, let the pointer hover over a colored bar. The CPU usage appears, shown as percentage and time values.
The QNX annotated source editor.