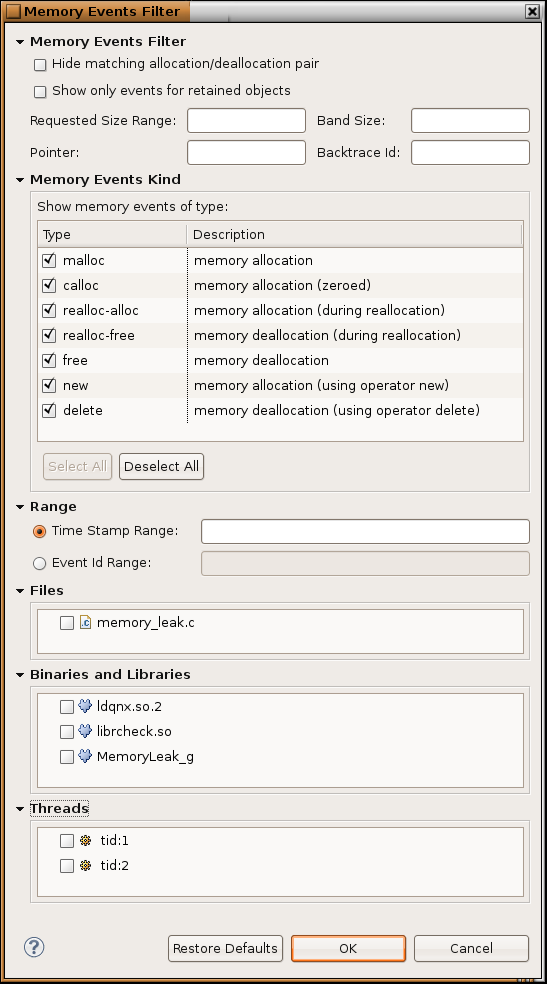
The Memory Events filter lets you filter a large amount of data to find specific events you are interested in. You can open the Memory Events filter from the Filter… action from Memory Events view.
| Field | Description |
|---|---|
| Hide matching allocation/deallocation pair | Show outstanding allocations when enabled (some might be memory leaks). |
| Show only events for retained objects | Hide all historical allocations and deallocations; only show events for recent allocations and deallocations for a given pointer. |
| Requested Size Range | Set a filter for the range (or a single value) of the requested allocation size (in bytes). |
| Band Size | Set a filter for the band size. All allocations that didn't band for a given size would be hidden. |
| Pointer | Set the allocation pointer or range. |
| Memory Events Kind | Select only events generated by specific functions. |
| Backtrace Id | Set automatically when the Show only same backtrace quick filter is used. |
| Time Stamp Range | Filter based on the timestamp. This filter can accept individual values or a range of values. The range can be open-ended, such as 100000-*. |
| Event Id Range | Filter based on the error ID (the Event ID column). It accepts individual values or ranges. The range can be open-ended, such as 25-*. |
| Files | Select a file where the error occurred, and all files referenced in the backtrace of the error. |
| Binaries and Libraries | Filter based on the binary or library where the error occurred, and all binaries referenced in the backtrace of the error. |
| Threads | When a problem is detected, filter errors based on the thread ID of a running thread when allocation or deallocation occurred. |