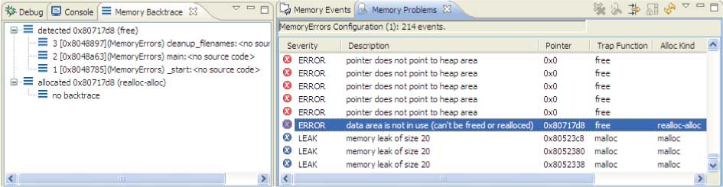
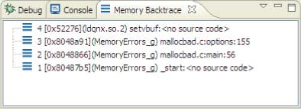
The purpose of this view is to provide backtracing capability for debugging your applications. Select a error from the Memory Problems view to display a call stack trace leading up to your selected memory error.
The Memory Backtrace view lets you:
- backtrace the calling thread
- backtrace a thread within the same process
- backtrace a thread in another process
- backtrace C code
- backtrace C++ code
When you select a particular event, the Memory Backtrace view shows the event’s details. If you double-click a particular event, the IDE highlights the event’s corresponding source code line (if it exists).
Backtracing is a best effort, and may at times be inaccurate due to the nature of backtracing (e.g. optimized code can confuse the backtracer).
You can't currently backtrace a thread on a remote node (i.e. over Qnet).
Backtracing a corrupt stack could cause a fatal SIGSEGV because libbacktrace doesn't trap SIGSEGV.
For PowerPC (PPC)targets only, the second backtrace entry isn't guaranteed to be accurate because of how the PPC handles the lr (link register). In the specific case of backtracing BT_SELF, the second entry of a backtrace will be accurate.